Generated with Monsha
Study Guide: Introduction to Infrared (IR) Spectroscopy
Anything · Grade 12 · English
Study Guide: Introduction to Infrared (IR) Spectroscopy
Introduction to Infrared (IR) Spectroscopy
Infrared (IR) Spectroscopy is an analytical technique used in organic chemistry to identify the functional groups present in a molecule. By exposing a sample to infrared radiation, we can observe how different bonds within the molecule absorb specific frequencies of energy. This "molecular fingerprint" allows chemists to determine if a substance contains features like hydroxyl groups (alcohols), carbonyl groups (ketones/aldehydes), or carbon-carbon double bonds.
1. How an IR Spectrometer Works
An IR spectrometer passes a beam of infrared light through a sample. Different bonds absorb different wavelengths of the light, while others pass through. The detector measures the intensity of the light that remains, and a computer converts this into a spectrum.
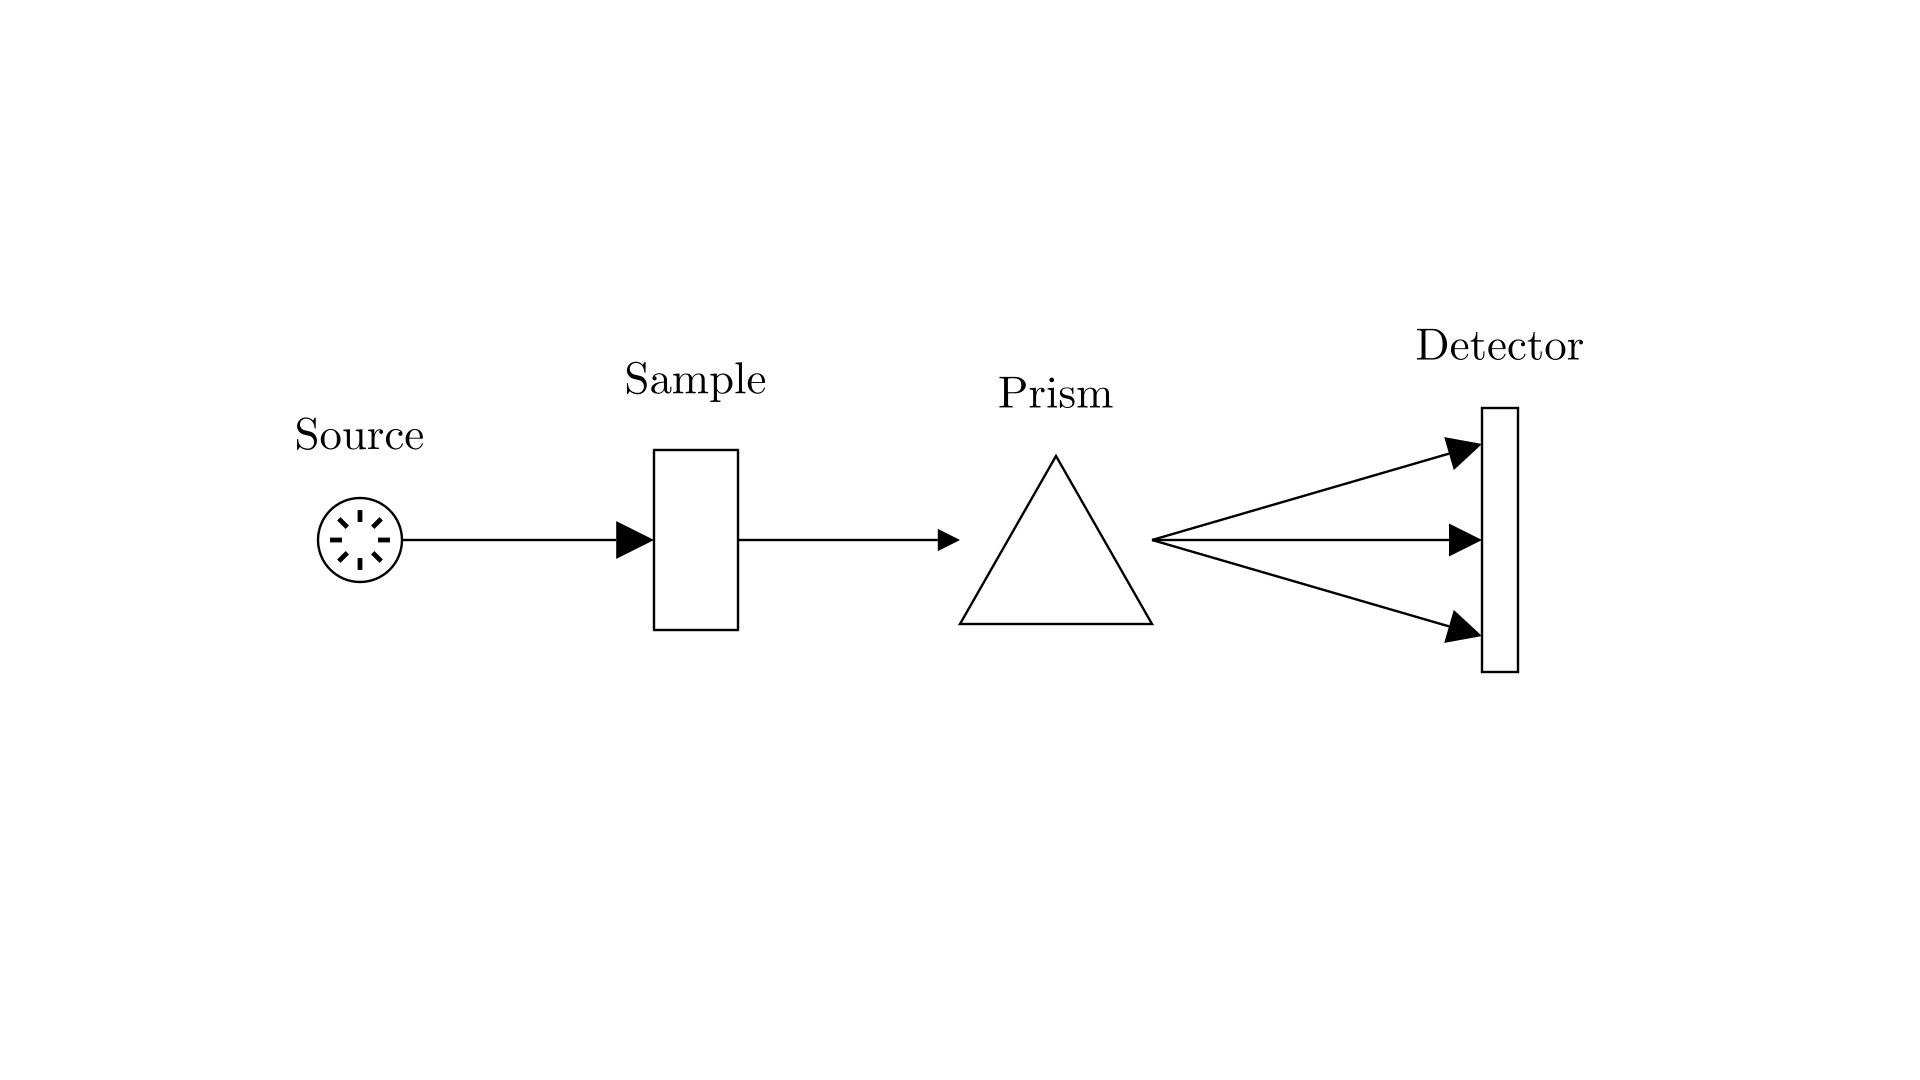
- Source: Provides a broad range of infrared frequencies.
- Sample: The substance being analyzed (can be liquid, solid, or gas).
- Prism/Diffraction Grating: Separates the light into its individual wavelengths.
- Detector: Measures the amount of light at each frequency that was not absorbed.
2. The Theory of Molecular Vibrations
Molecules are not static; their bonds act like springs that are constantly vibrating. When a molecule absorbs IR radiation, the energy causes these vibrations to increase in amplitude. There are two primary types of vibrations:
- Stretching Vibrations: These involve a change in bond length. Because stretching requires significant energy, these peaks appear at higher wavenumbers (generally ).
- Bending Vibrations: These involve a change in bond angle (e.g., scissoring or rocking). Bending requires less energy, so these peaks appear at lower wavenumbers (generally below ).
Factors Affecting Vibration Frequency
- Bond Strength: Stronger bonds (like triple bonds) have higher frequencies than weaker bonds (like single bonds).
- Atomic Mass: Bonds involving lighter atoms (like Hydrogen) vibrate at higher frequencies than those involving heavier atoms.
3. Interpreting an IR Spectrum
An IR spectrum is plotted as Transmittance (%) vs. Wavenumber (
). A "peak" in IR spectroscopy is actually a dip in transmittance, indicating where the molecule absorbed the light.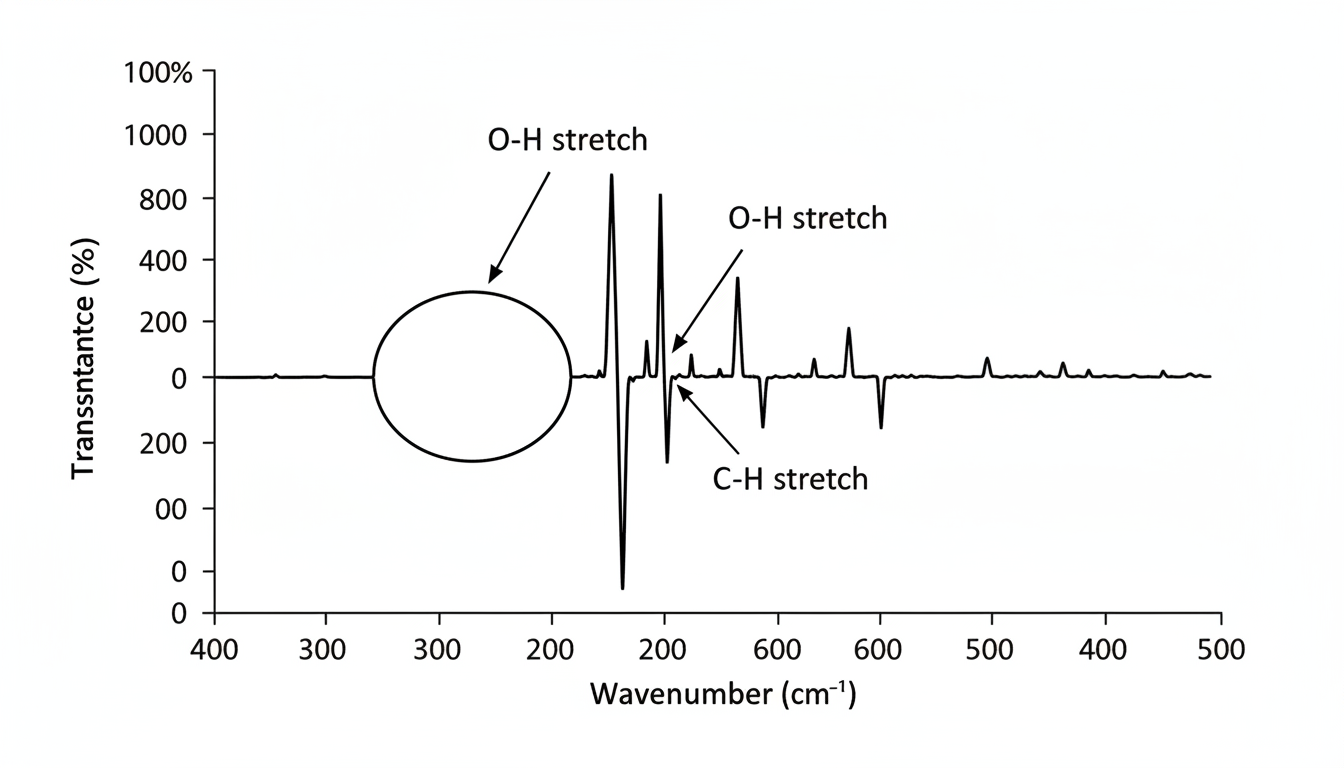
In the spectrum of Ethanol above, notice the broad dip around
—this is the classic "signature" of an alcohol group.4. Common IR Absorption Frequencies
Below is a reference table for the functional groups most commonly encountered in Grade 12 Chemistry:
Functional Group | Bond Type | Frequency Range ( ) | Appearance |
|---|---|---|---|
Alcohol | | | Strong, broad |
Carboxylic Acid | | | Very strong, very broad |
Amine / Amide | | | Medium, sharp |
Alkane | ( ) | | Strong |
Carbonyl | | | Very strong, sharp |
Alkene | | | Medium to weak |
Nitrile | | | Medium, sharp |
5. Summary of Analysis Steps
When analyzing an unknown spectrum, follow these steps:
- Check for Carbonyl (): Look for a strong, sharp peak around.
- Check for Alcohol/Acid (): Look for a broad peak above.
- Check for Unsaturations: Look for peaks just above () or near().
- The Fingerprint Region: Ignore the complex area below unless you are comparing the spectrum to a known database sample.