Generated with Monsha
Save this resource to edit, expand, or export it, or create more resources for free.
Population Dynamics and Carrying Capacity
Anything
Grade 10
English
Population Dynamics and Carrying Capacity
Activity 1: Growth Models Review
Instructions: Choose the best answer for each question based on your understanding of exponential and logistic population growth.
- Which of the following best describes exponential growth? a. Population growth that slows down as it reaches a maximum limit b. Population growth that doubles at a constant rate, resulting in a J-shaped curve c. A population that remains stable over long periods d. Growth that occurs when resources are extremely limited
Answer: _____
- The term carrying capacity (K) refers to: a. The total number of offspring a single female can produce b. The maximum number of individuals of a species that an environment can sustain indefinitely c. The minimum population size required to prevent extinction d. The rate at which a population increases every year
Answer: _____
- What happens to the growth rate of a population as it approaches its carrying capacity in a logistic model? a. The growth rate slows down and eventually reaches zero b. The growth rate increases rapidly c. The growth rate becomes negative immediately d. The growth rate remains constant regardless of resource availability
Answer: _____
- Which graph shape is characteristic of logistic growth? a. S-shaped curve b. J-shaped curve c. Straight diagonal line d. A downward sloping curve
Answer: _____
Activity 2: Interpreting the Logistic Curve
Instructions: Analyze Figure 1 below and answer the questions that follow.
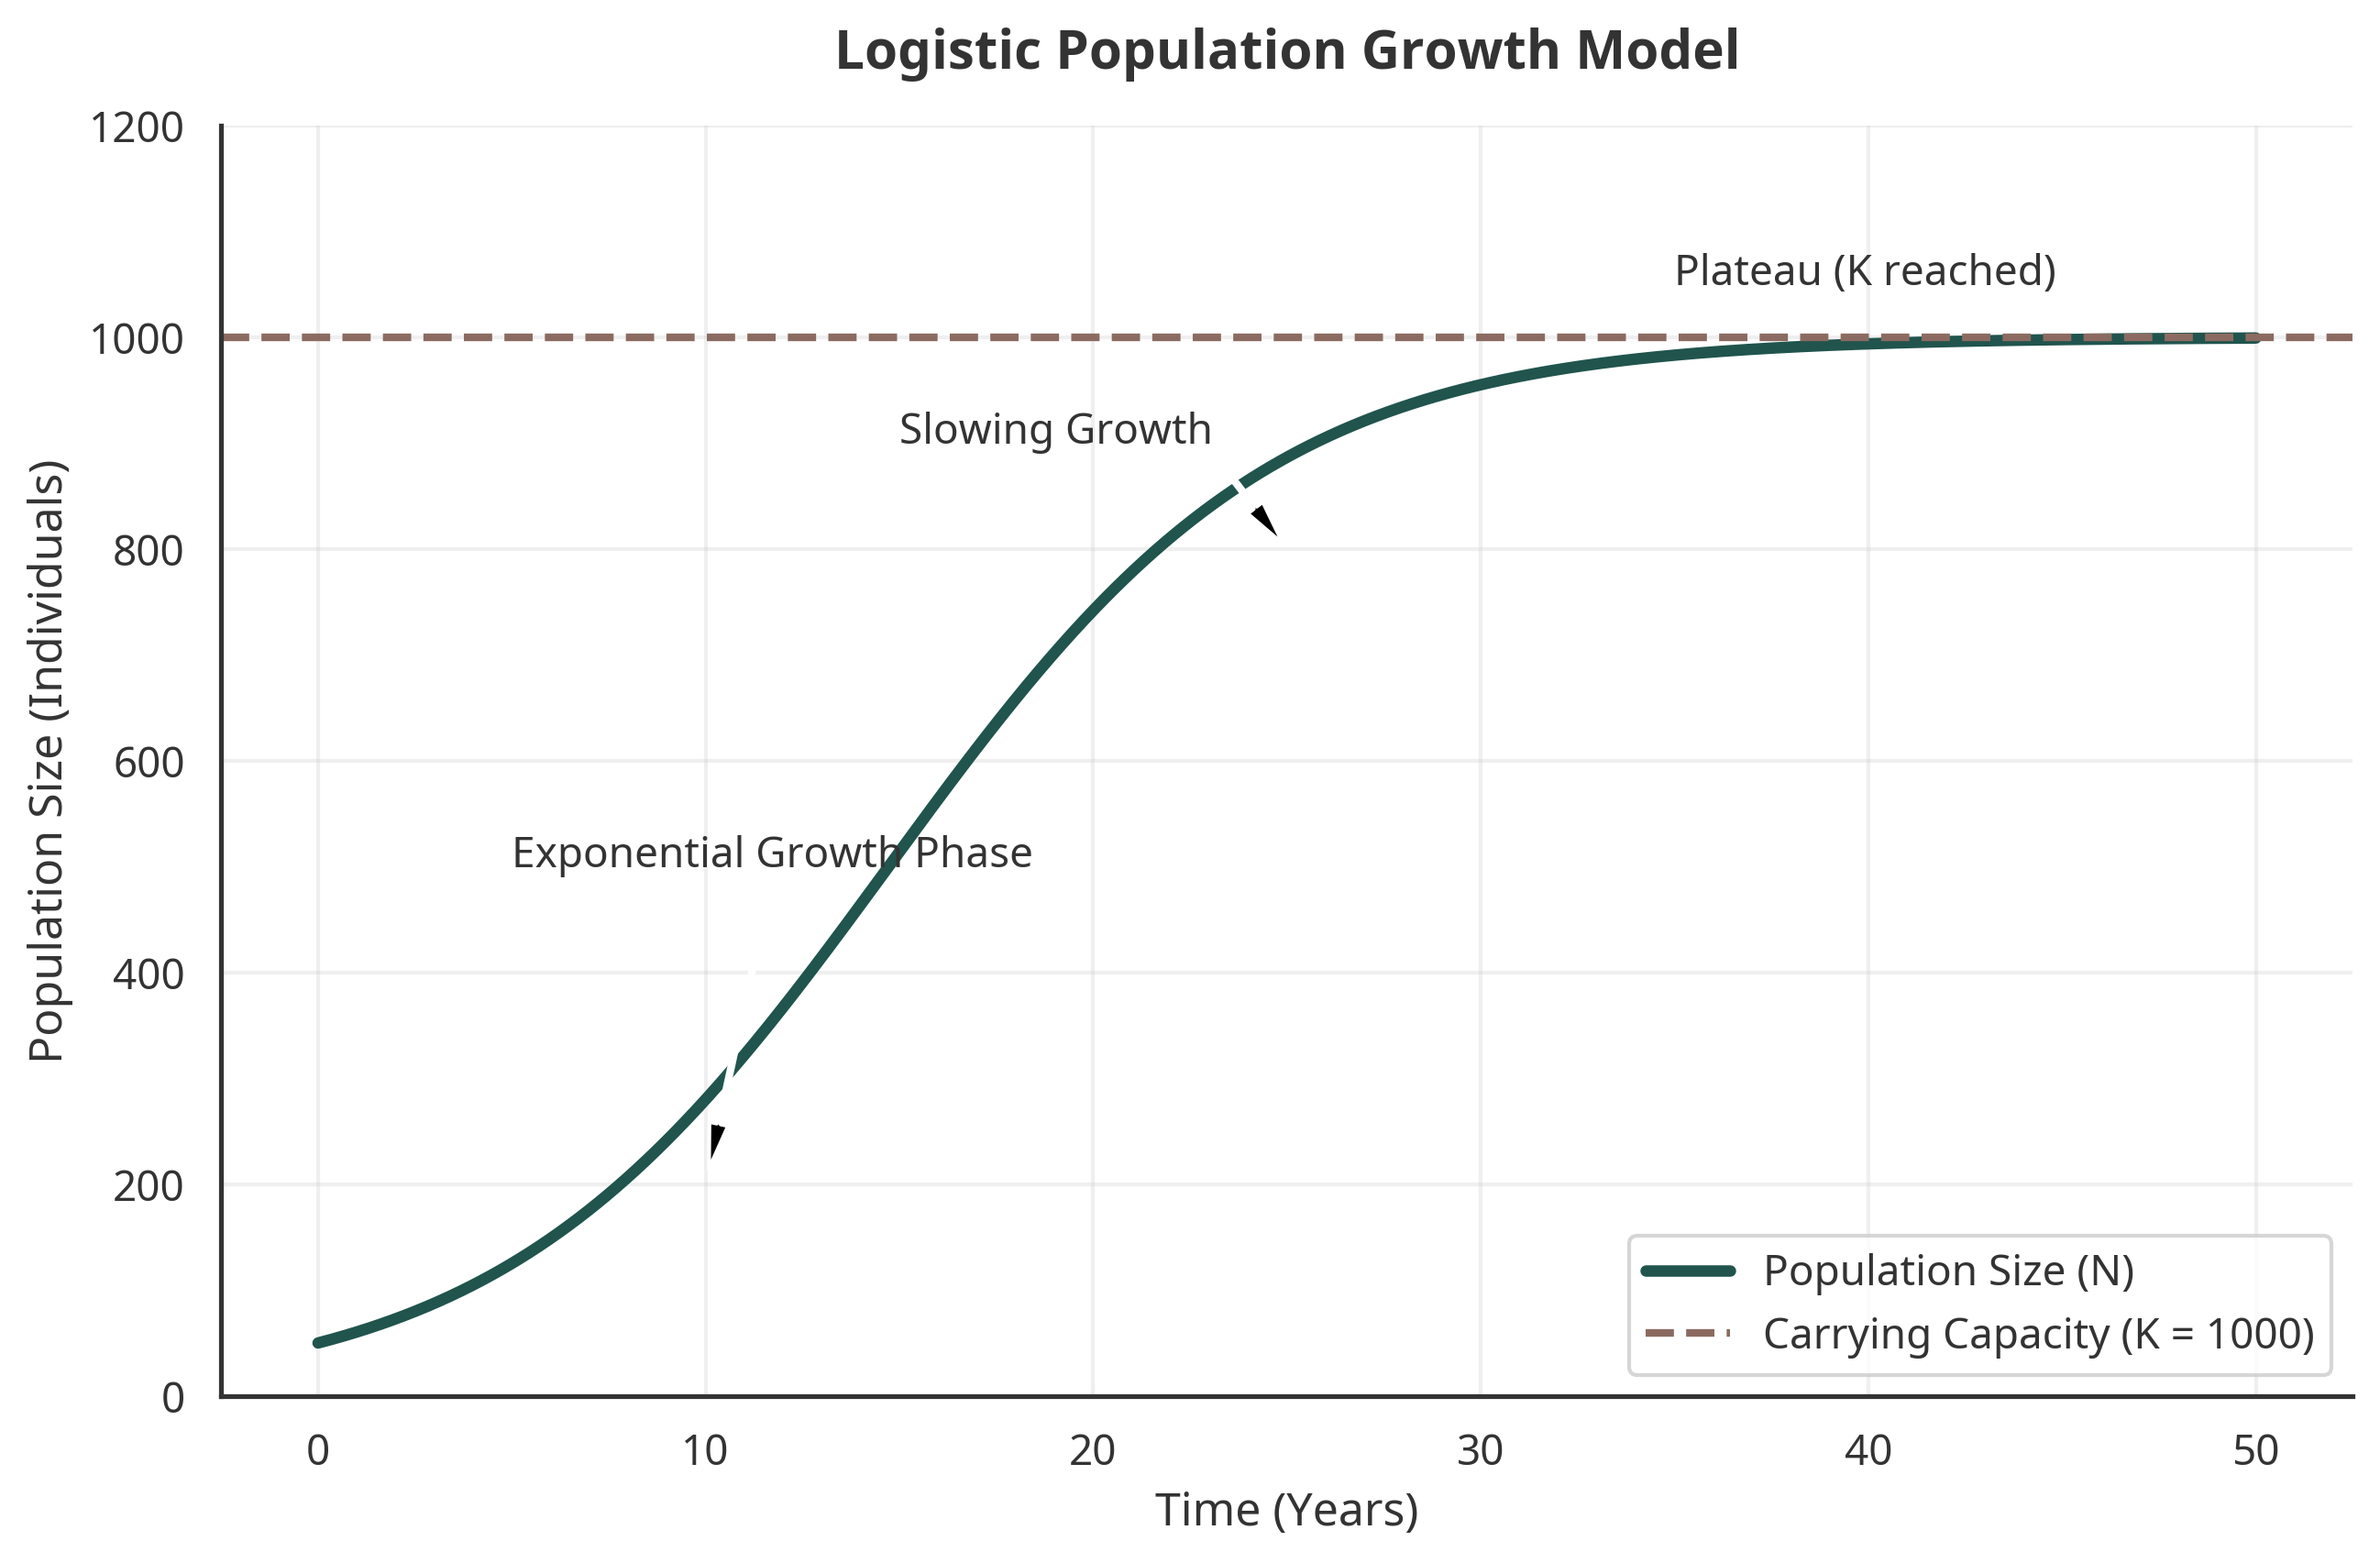
- Identify the carrying capacity value on the graph. What is the approximate population size where the curve flattens out?
- Look at the phase labeled "Exponential Growth Phase." Why are the individuals able to increase so rapidly during this time?
- Why does the population growth rate begin to slow down between Year 20 and Year 35? Use the concept of "resources" in your explanation.
- What would likely happen if the population significantly overshot (went above) the dashed line labeled 'K'?
Activity 3: Case Study - Philippine Population Trends
Instructions: The Philippines has seen significant population changes over the last century. Use Figure 2 to analyze historical data and future projections.
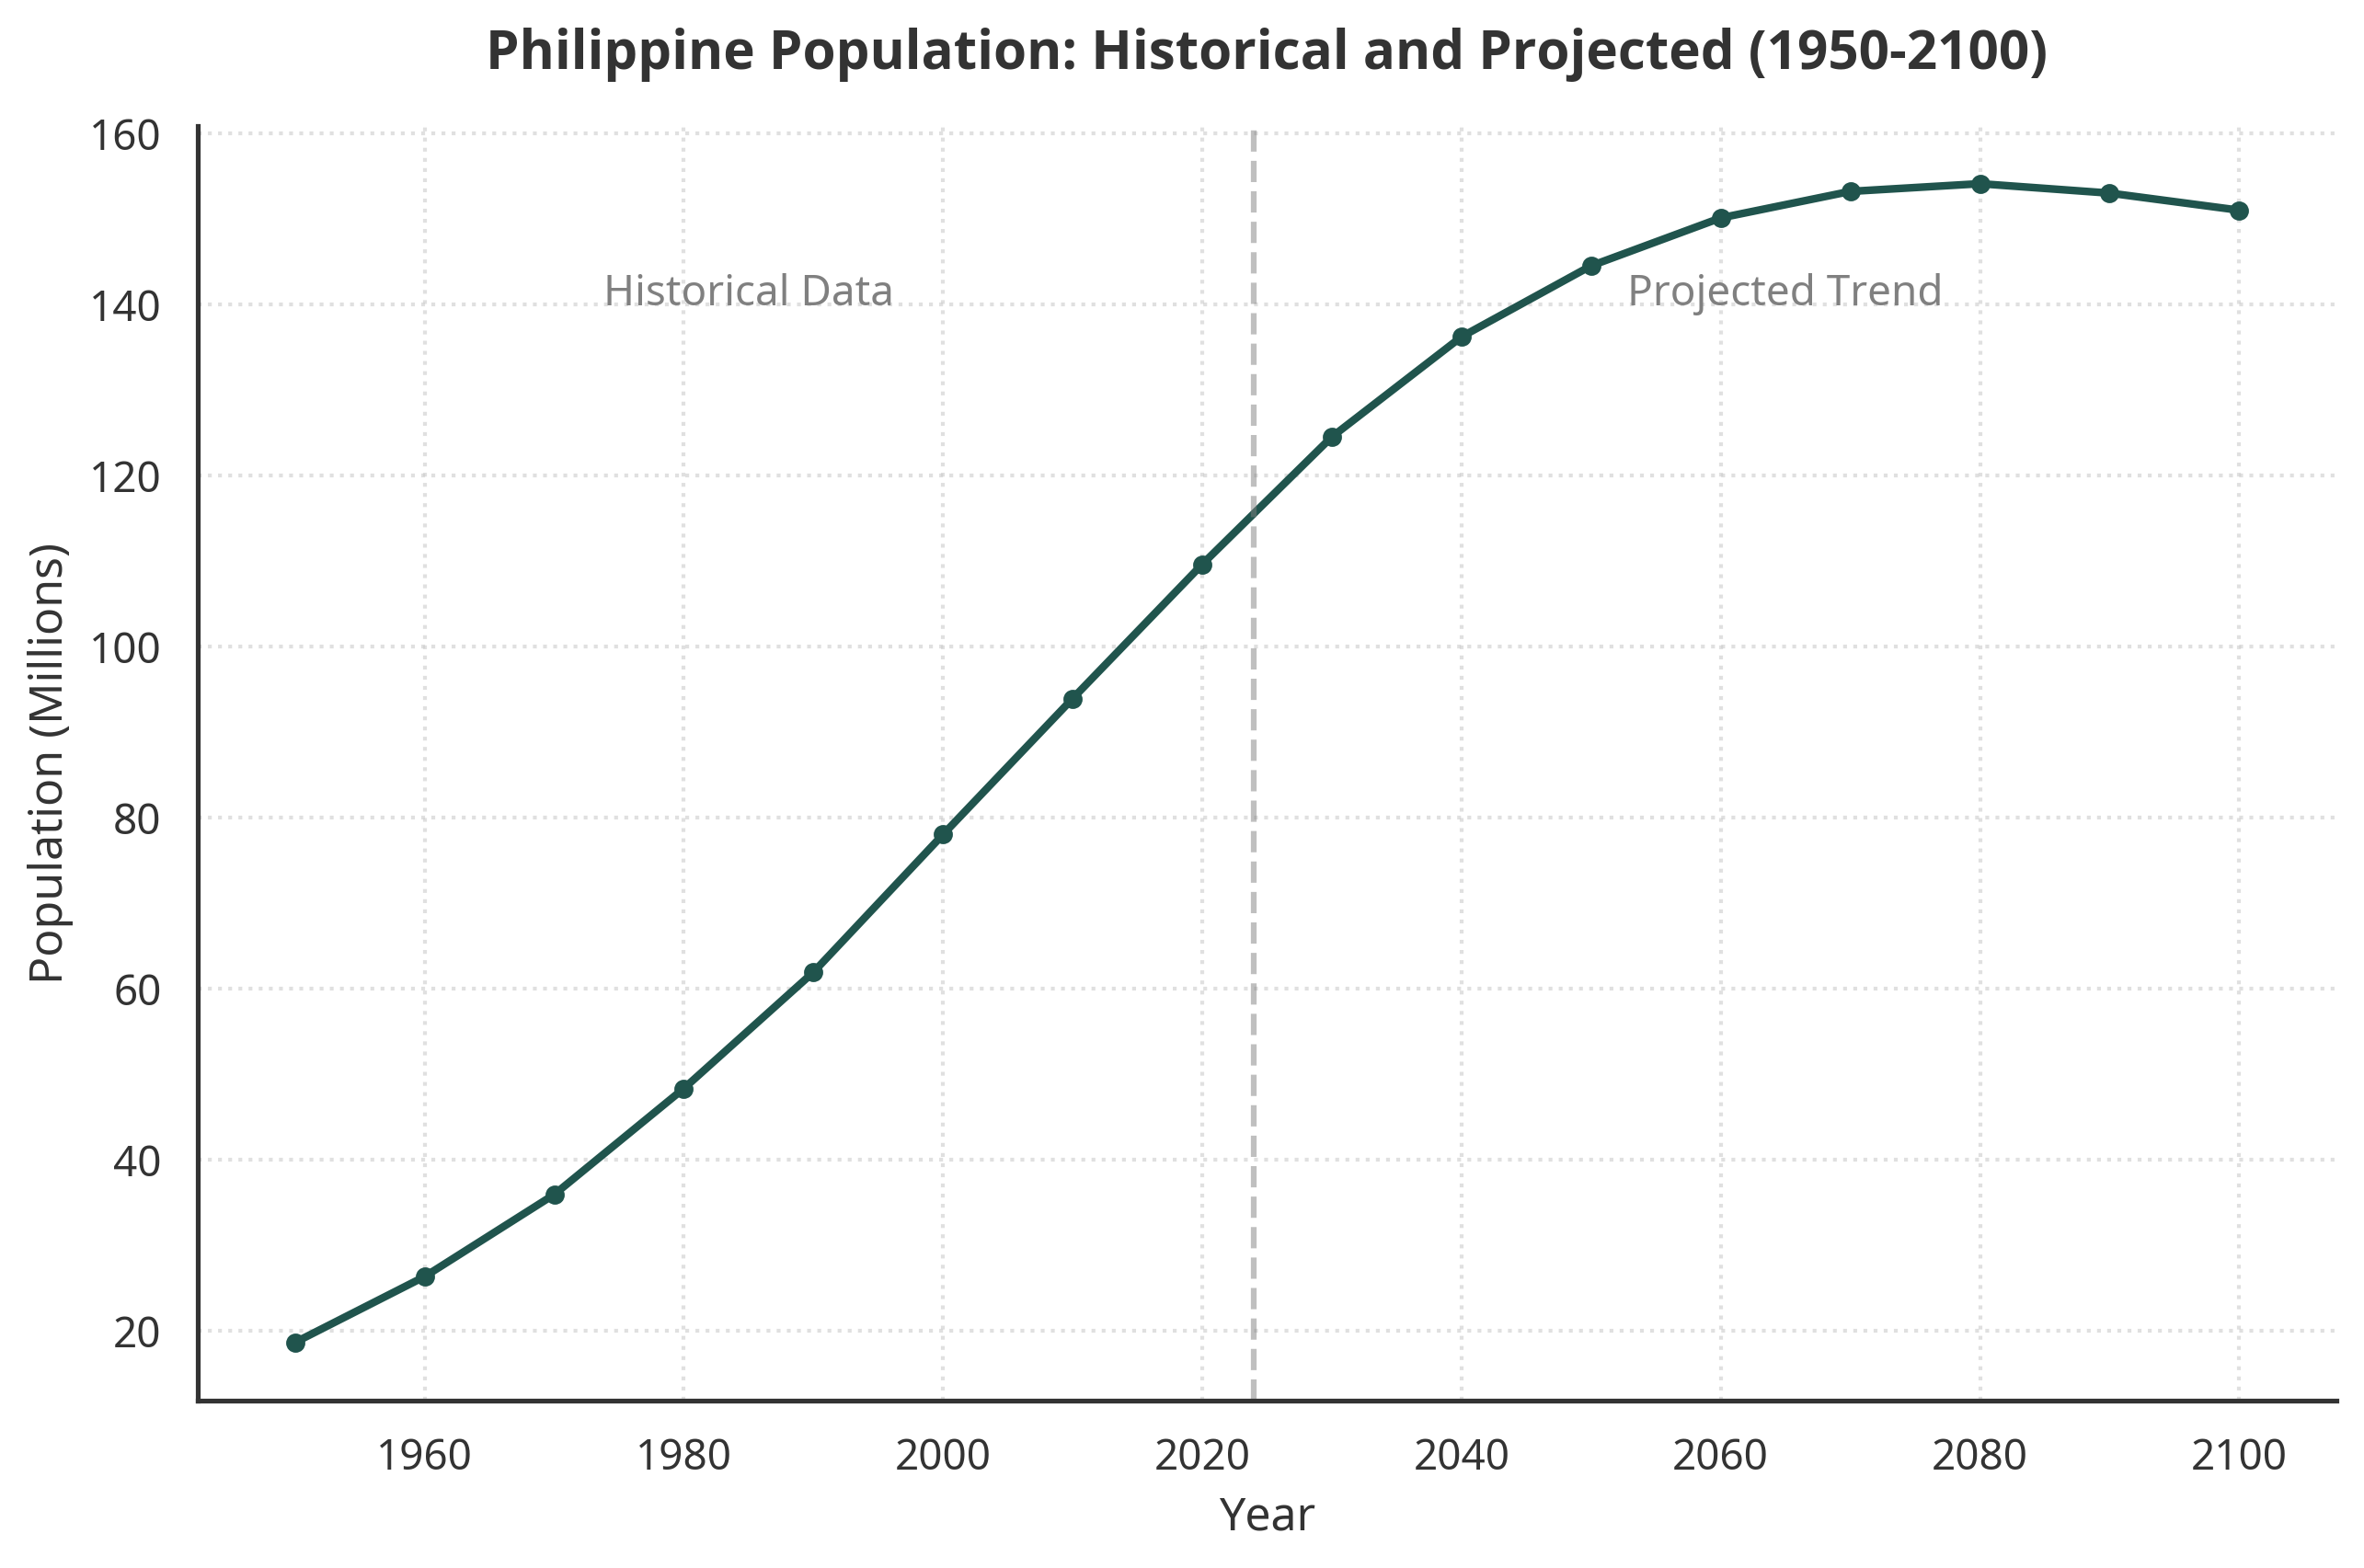
- Based on the graph, describe the trend of the Philippine population from 1950 to 2020. Is this more like a J-curve or an S-curve during this specific period?
- Examine the projection from 2050 to 2100. What is happening to the slope (steepness) of the line? What does this tell you about the rate of population growth?
- The model shows an eventual plateau (flattening) around the year 2080. Using the concept of carrying capacity, explain why researchers might project the population to level off rather than keep growing forever.
Activity 4: Modeling Resource Limits
Instructions: Imagine a population of rabbits introduced to a small island with a fixed amount of grass (the primary resource). Below is the data recorded over 10 years.
Year | Population Size (Individuals) |
|---|---|
1 | 10 |
2 | 25 |
3 | 60 |
4 | 120 |
5 | 180 |
6 | 220 |
7 | 240 |
8 | 245 |
9 | 250 |
10 | 250 |
Part A: Graph the Results
Sketch the population curve on the axes provided below. Be sure to label your axes and mark the carrying capacity (K).
Population Size^||||||||+-----------------------------------> Time (Years)Part B: Analysis
- Based on your graph and the data table, what is the carrying capacity of the island for rabbits?
- At what point (which year) did the population growth start to noticeably slow down?
- Connect the three ideas: Population Size, Available Resources, and Carrying Capacity. Explain how they interact to determine the final shape of the curve.