Generated with Monsha
Save this resource to edit, expand, or export it, or create more resources for free.
Weather vs. Climate Questions — 6th Grade Science (with Answer Key)
Questions
Grade 6
English
Weather vs. Climate Questions — 6th Grade Science (with Answer Key)
Data Reference: Weather and Climate Analysis
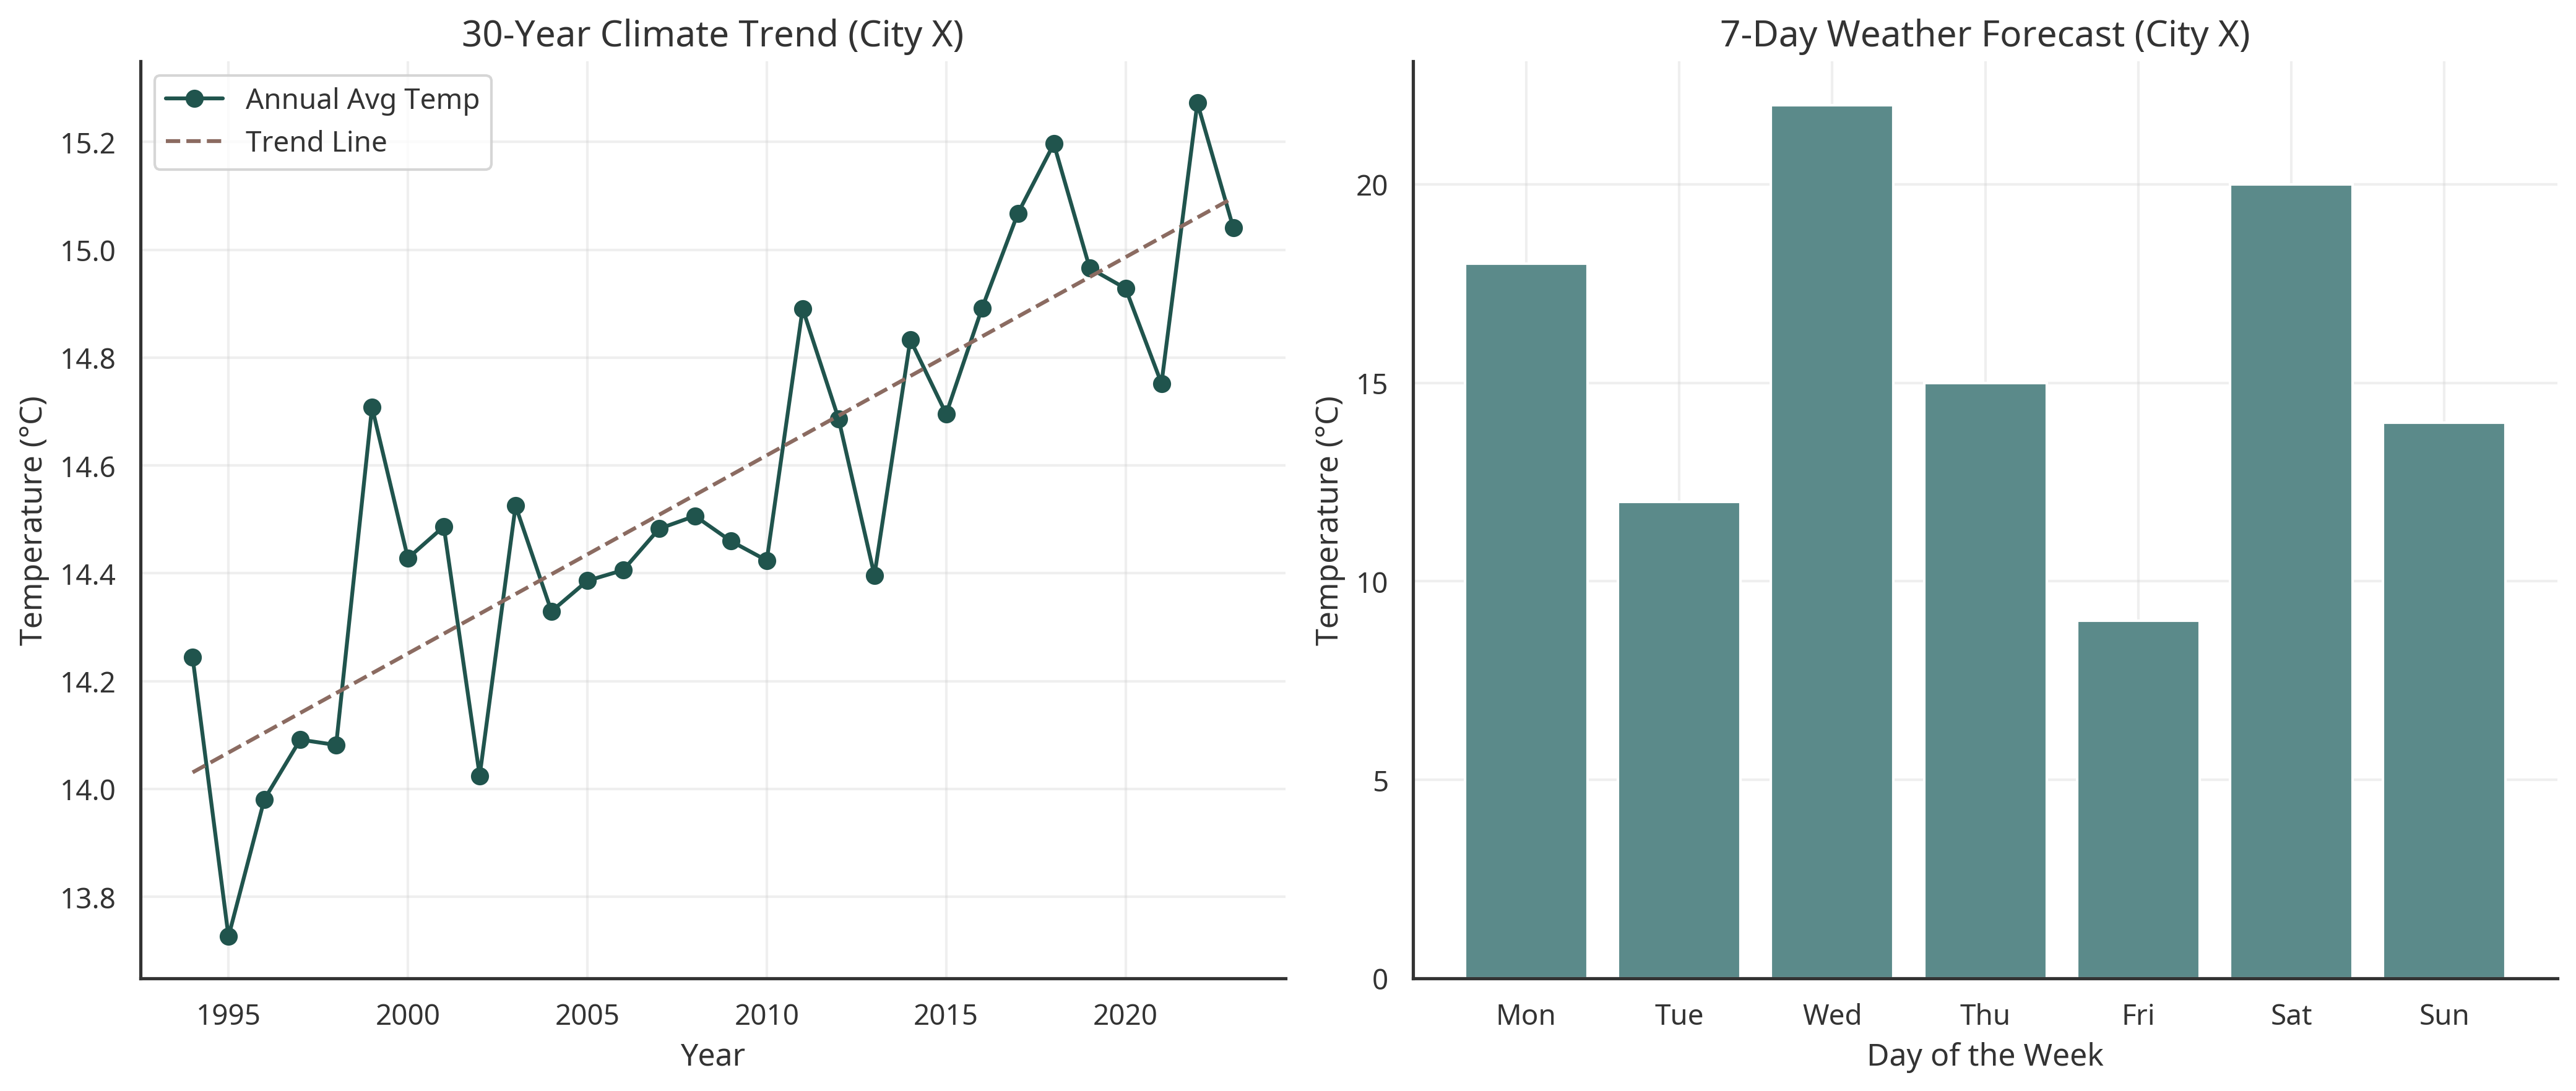
Use the following data table and chart to answer the questions in this set.
Table 1: Monthly Average Temperature and Rainfall for Two Cities
Month | City A (Inland) Temp (°C) | City A (Inland) Rain (mm) | City B (Coastal) Temp (°C) | City B (Coastal) Rain (mm) |
|---|---|---|---|---|
January | -5 | 20 | 8 | 120 |
February | -3 | 25 | 9 | 110 |
March | 5 | 40 | 11 | 90 |
April | 12 | 60 | 14 | 70 |
May | 18 | 80 | 17 | 50 |
June | 24 | 90 | 20 | 40 |
July | 28 | 70 | 22 | 30 |
August | 26 | 60 | 22 | 35 |
September | 20 | 50 | 19 | 55 |
October | 13 | 45 | 15 | 80 |
November | 5 | 35 | 11 | 100 |
December | -2 | 25 | 8 | 130 |
DOK 1: Recall & Reproduction
- Define weather in your own words.
- Define climate in your own words.
- Which of the following statements specifically describes weather?
1. Identify the statement that describes weather.
A. Deserts are characterized by very low humidity and high heat.
B. Winters in the Midwest are typically cold and snowy.
C. A sudden thunderstorm caused localized flooding this afternoon.
D. The average rainfall in the rainforest is over 2,000 mm per year.
4. Matching: Match each tool to the atmospheric condition it measures.
Tool | Condition Measured |
|---|---|
A. Anemometer | 1. Air Pressure |
B. Barometer | 2. Wind Speed |
C. Hygrometer | 3. Temperature |
D. Thermometer | 4. Humidity |
DOK 2: Skills & Concepts
- Classify the following 6 statements as either Weather (W) or Climate (C):
- It is 75°F outside right now. [___]
- The Gobi Desert receives less than 10 inches of rain annually. [___]
- There is a hurricane warning for the coast this weekend. [___]
- The humidity is 90% today, making it feel very sticky. [___]
- Southeast Asia has a monsoon season from June to September. [___]
- The record high for this city is 105°F, set back in 1980. [___]
- Use Table 1 to compare City A and City B. How do the winter temperatures (December–February) and total rainfall patterns differ between these two locations?
- In exactly one sentence, explain why a single event, like "it snowed today," does not disprove the concept of a warming global climate.
- Looking at Figure 1, compare the 30-year trend line to the 7-day forecast. What does the stability of the trend line tell you about climate compared to the variability shown in the weekly forecast?
DOK 3: Strategic Thinking
- Evaluate: A student claims, "This winter was the coldest on record in my town, so climate change must have stopped." Using the relationship between weather and climate, evaluate this claim. Is it scientifically sound? Why or why not?
- Argument: A farmer wants to plant a crop that requires mild, wet winters and moderate, dry summers. Based on the data in Table 1, argue which city (A or B) the farmer should choose. Support your choice with specific data points from the table.
- Design: Design a simple classroom investigation that students could perform over two months to demonstrate the difference between weather variability and climate stability. List the steps and what data you would collect.
- Predict: Predict how the temperature data for a coastal city (like City B) might differ from an inland city (like City A) if both were at the same latitude. Justify your prediction using your knowledge of how large bodies of water affect temperature.