Generated with Monsha
Interpreting Graphs Exit Slips — 8th Grade Science & Math (With Answer Key)
Questions · Grade 8 · English
Interpreting Graphs Exit Slips — 8th Grade Science & Math (With Answer Key)
Exit Slip 1: Line Graph Analysis
:::
Name: __________________________
Date: __________________________
:::
Analyze the line graph below showing the temperature of a cooling liquid over a 20-minute period.
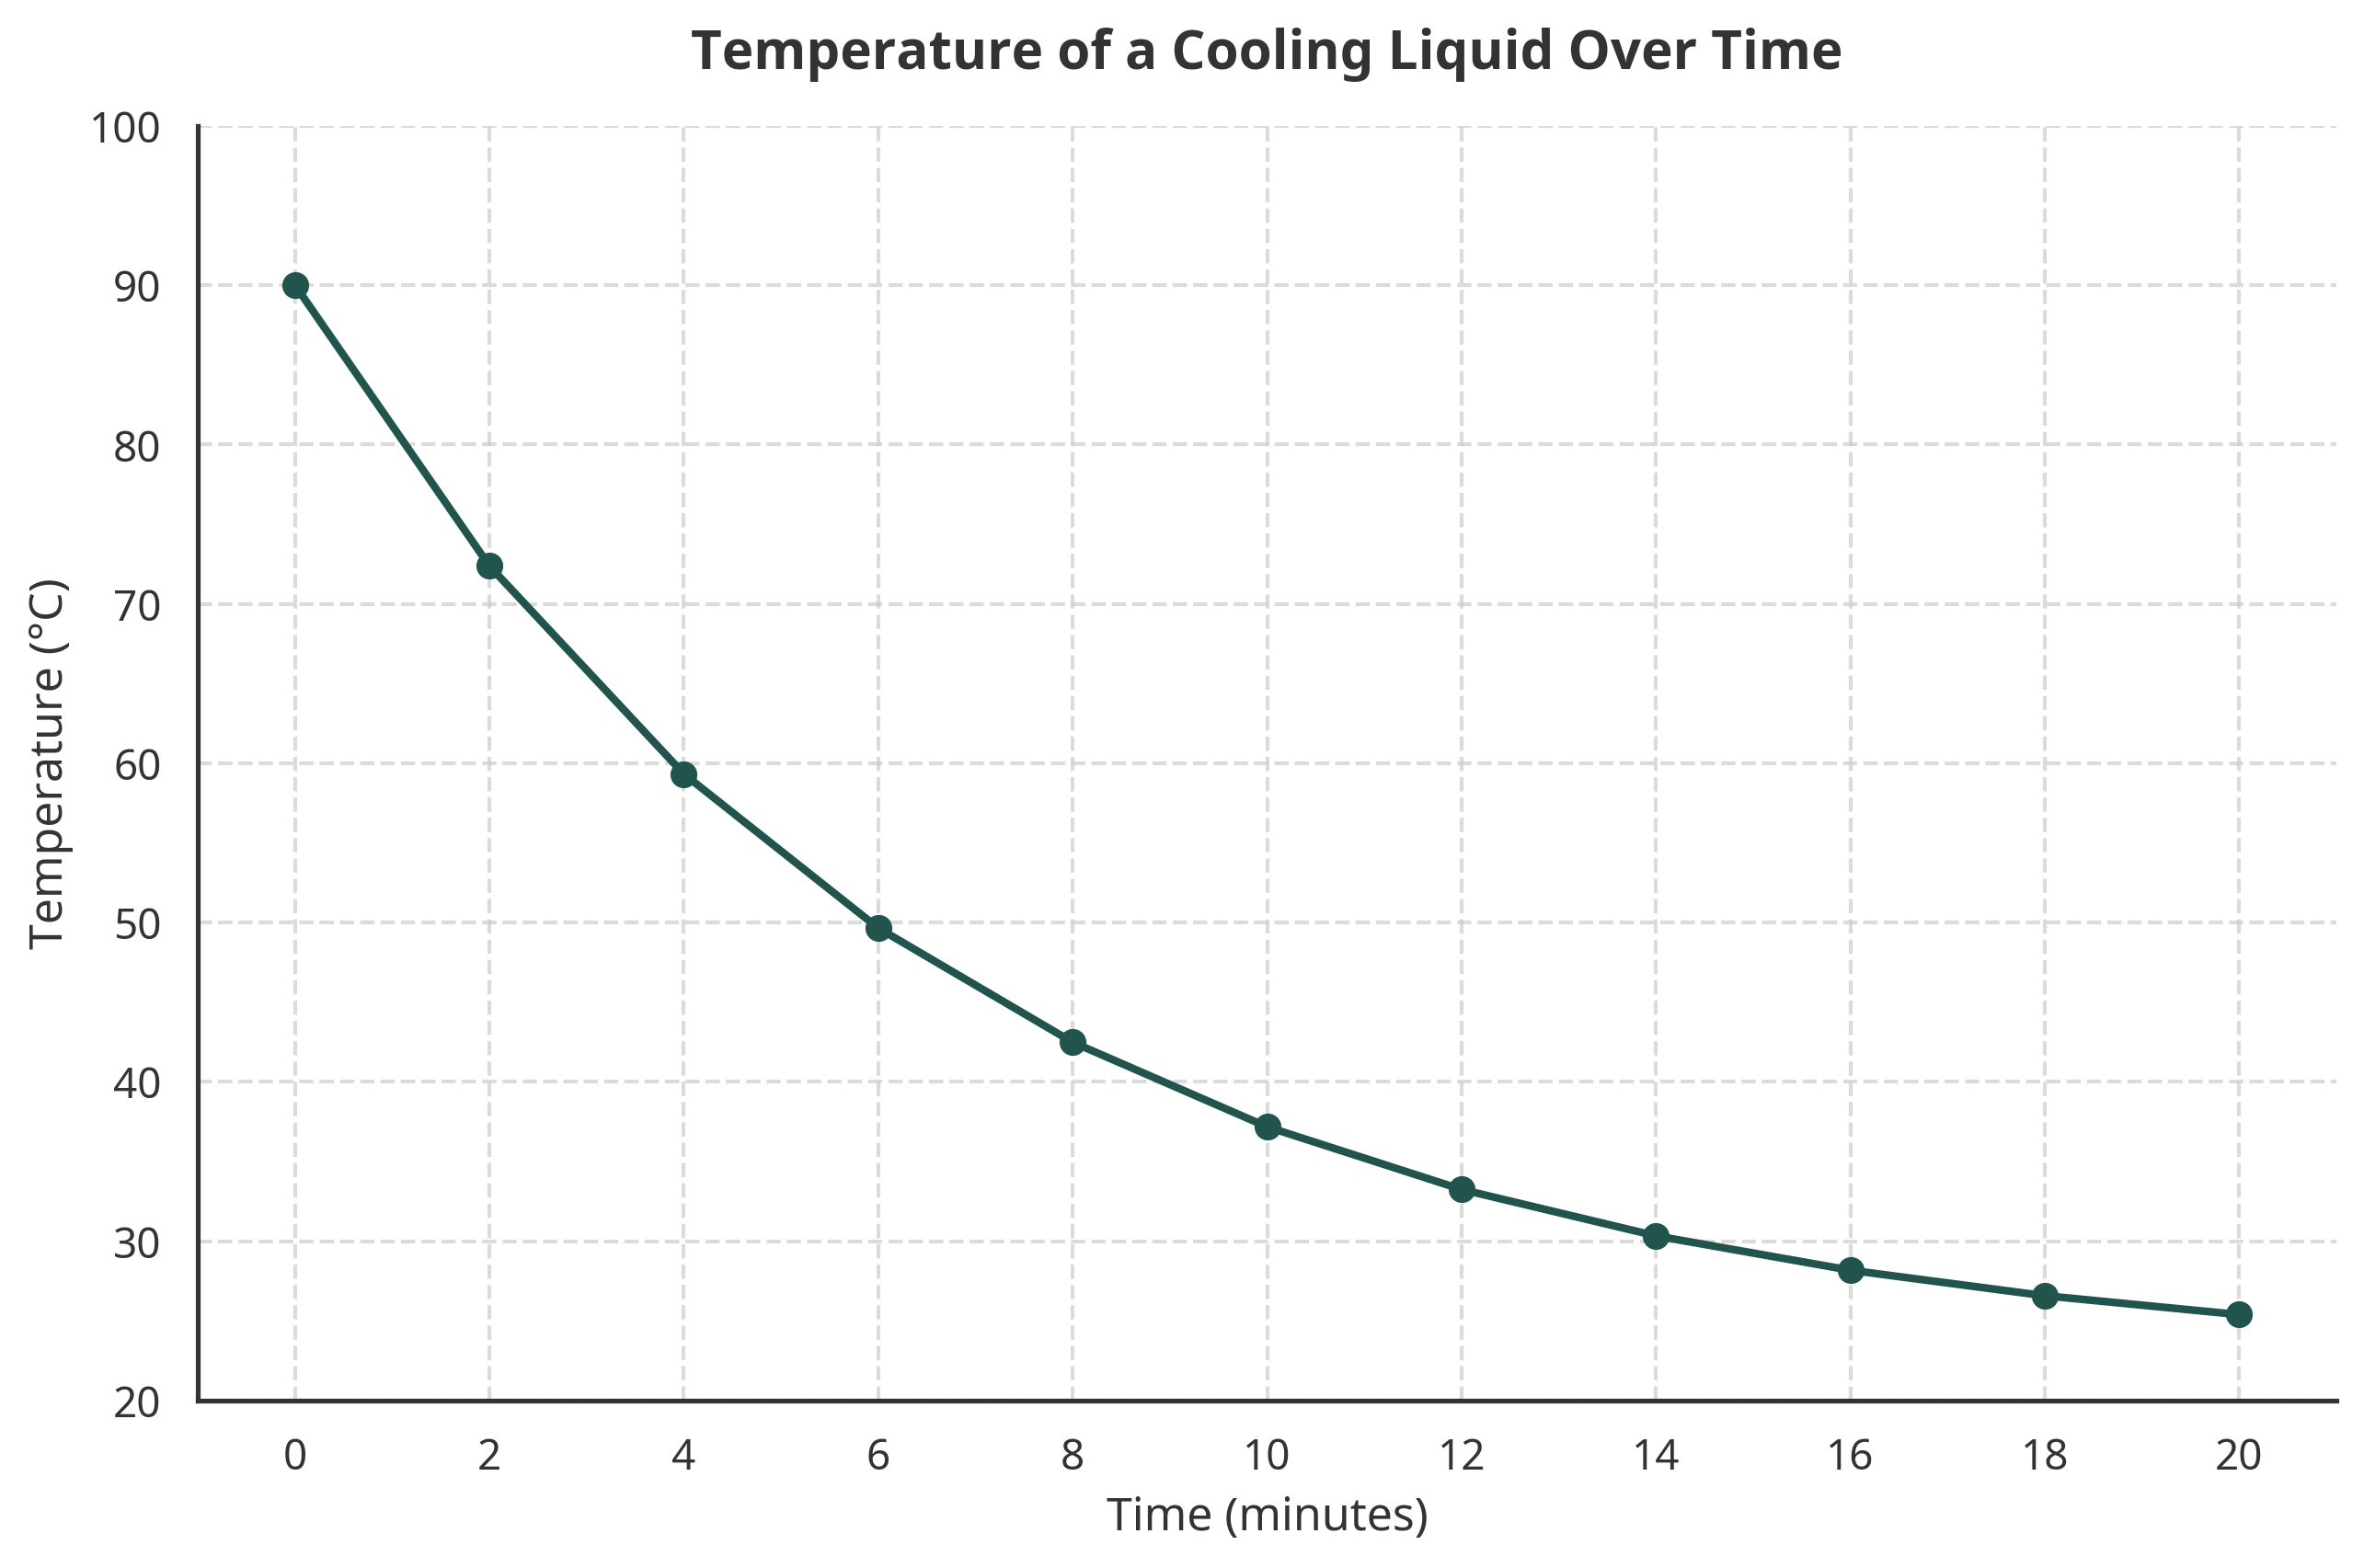
- Data Reading: What is the approximate temperature of the liquid at the 10-minute mark?
- Trend Analysis: Describe the overall trend of the temperature. During which time interval (e.g., 0-5 mins, 5-10 mins) is the temperature changing the fastest?
- Prediction: Based on the pattern in the graph, predict the temperature at 25 minutes. Justify your answer using the concept of room temperature/equilibrium.
Exit Slip 2: Bar Graph Analysis
:::
Name: __________________________
Date: __________________________
:::
Review the bar graph below which displays the growth of a specific plant species under four different lighting conditions over two weeks.
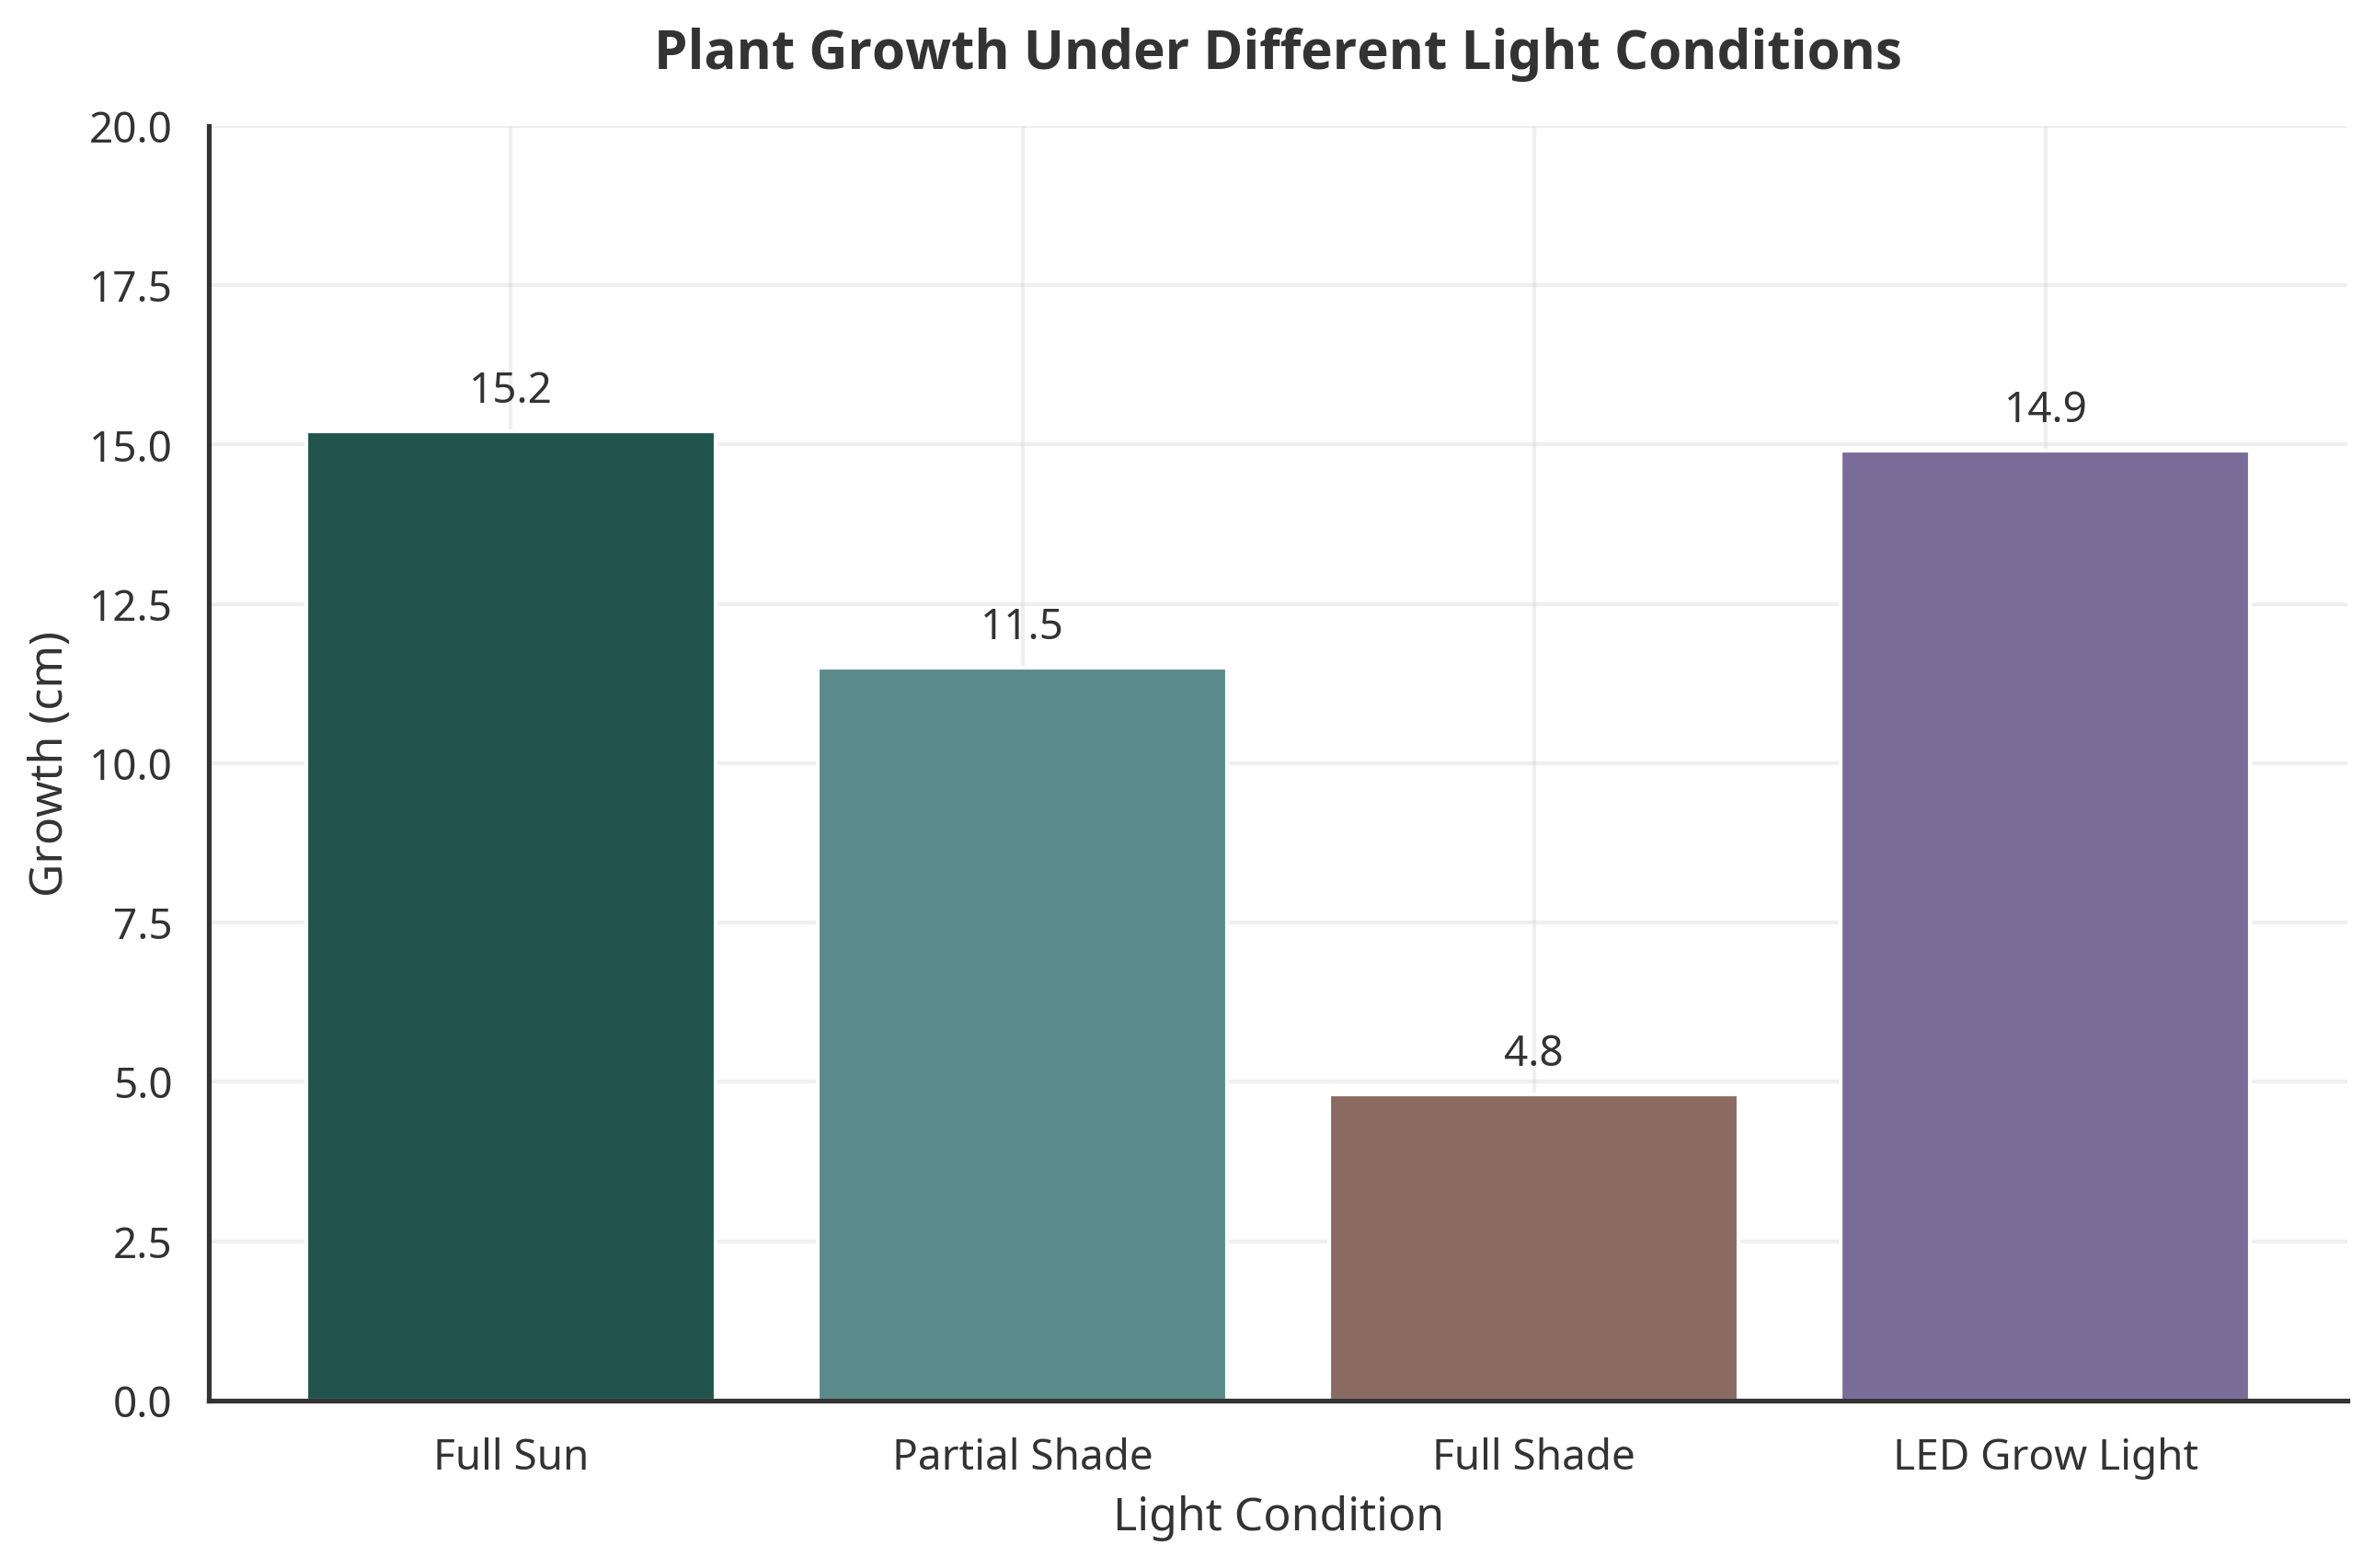
- Comparison: Which light condition resulted in the most growth, and which resulted in the least?
- Calculation: How many more centimeters did the plant in the "Full Sun" condition grow compared to the plant in the "Full Shade" condition?
- Evidence-Based Claim: Make a claim about the best artificial lighting substitute for natural sunlight based on this data. What evidence from the graph supports your claim?
Exit Slip 3: Scatter Plot Analysis
:::
Name: __________________________
Date: __________________________
:::
Examine the scatter plot showing the relationship between hours of sleep the night before an exam and the students' quiz scores.
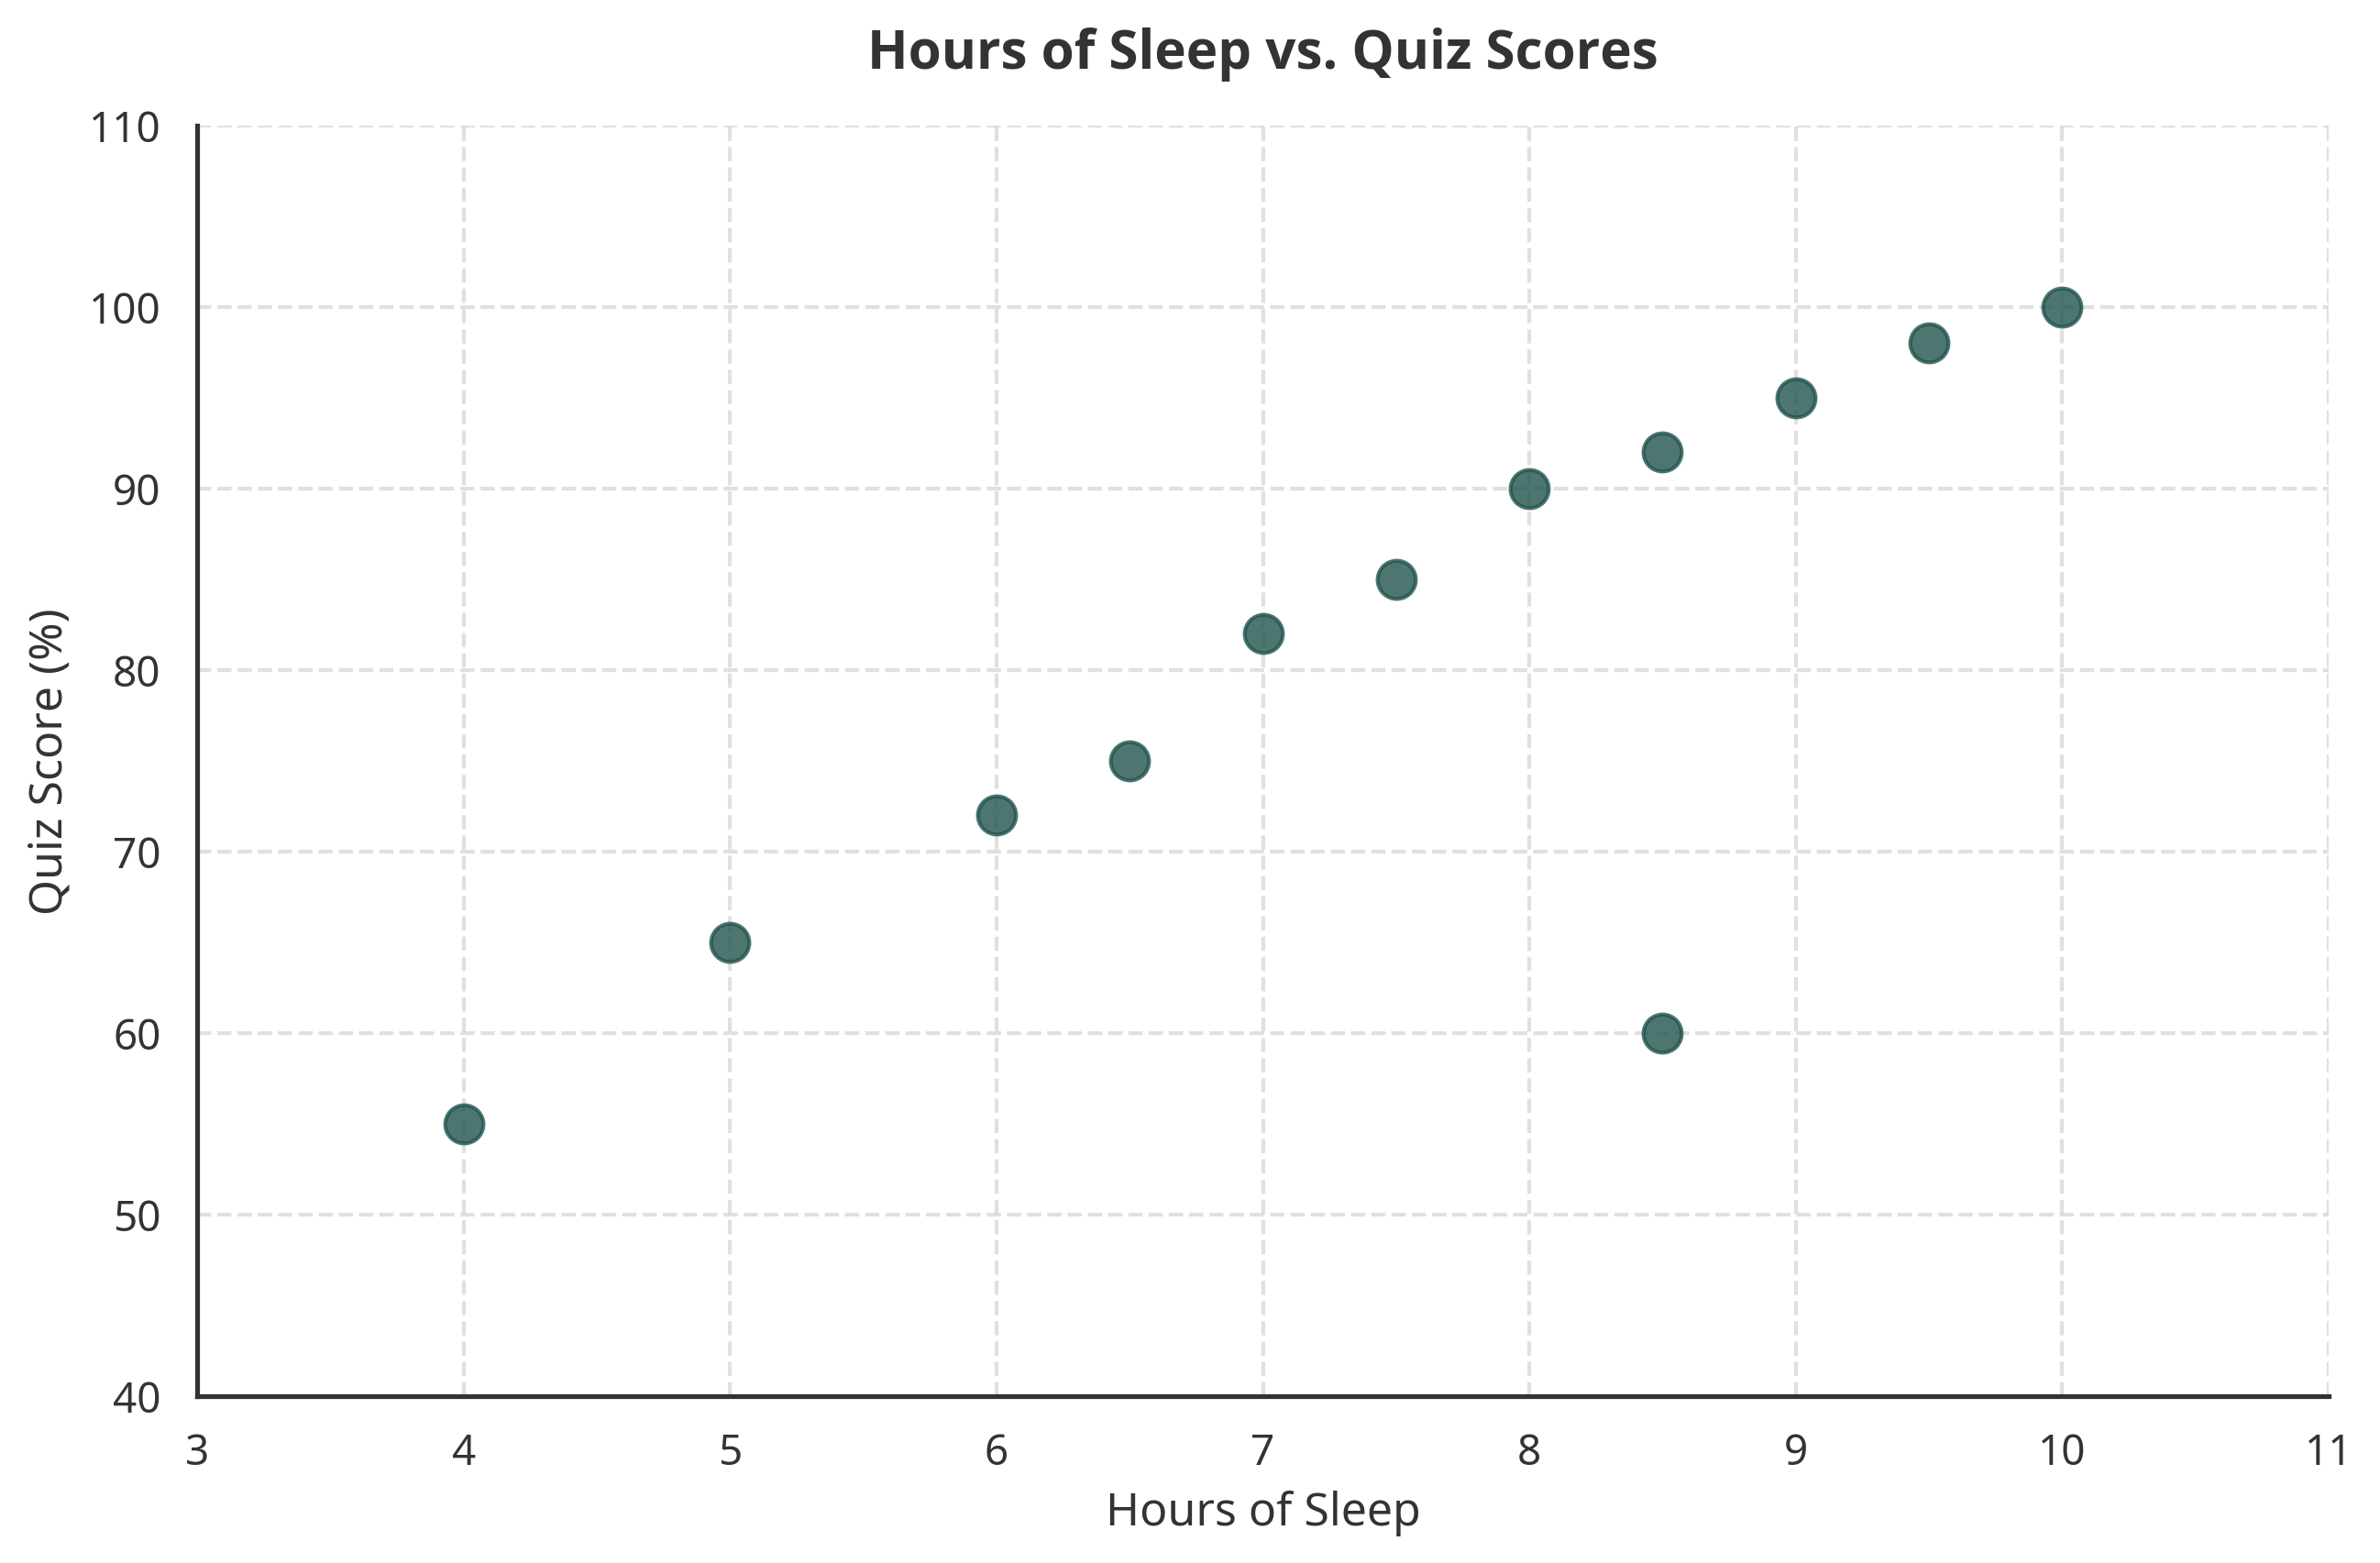
- Association: Describe the association (correlation) shown in the scatter plot. Is it positive, negative, or is there no association?
- Outlier Identification: Identify the outlier in the data set (state the approximate sleep hours and score). Why is this data point considered an outlier?
- Critical Thinking: A student looks at this graph and says, "This proves that sleeping more causes you to get better grades." Is this statement accurate? Explain the difference between correlation and causation in the context of this graph.