Generated with Monsha
IELTS Academic Writing Task 1: Analyzing Library Trends
Smart Worksheet · Grade 12 · English
IELTS Academic Writing Task 1: Analyzing Library Trends
IELTS Writing Task 1: Little Chalfont Library Data Analysis
Instructions: This worksheet is designed to help you prepare for IELTS Academic Writing Task 1. You will analyze three visuals based on data from Little Chalfont Library: a pie chart showing membership ages, a table showing loan categories, and a bar chart showing loan trends over a decade. Complete all 20 activities to build your skills in data interpretation and report writing.
Visual References
Total Loans by Category (2016) | Percentage (%) |
|---|---|
Children’s fiction | 38% |
Children’s non-fiction | 6% |
Children’s DVDs | 1% |
Young adults | 2% |
Adult fiction | 38% |
Adult non-fiction | 13% |
Adult audio books | 2% |
Activity 1: Vocabulary Match - Trend Verbs
Match the verbs on the left with their meanings regarding the Bar Chart trends on the right.
- Fluctuated A. Stayed the same for a period
- Peaked B. Rose and fell multiple times
- Remained stable C. Reached the highest point
- Climbed D. Increased gradually
Answers: 1. ____ 2. ____ 3. ____ 4. ____
Activity 2: Data Extraction - Pie Chart (True/False)
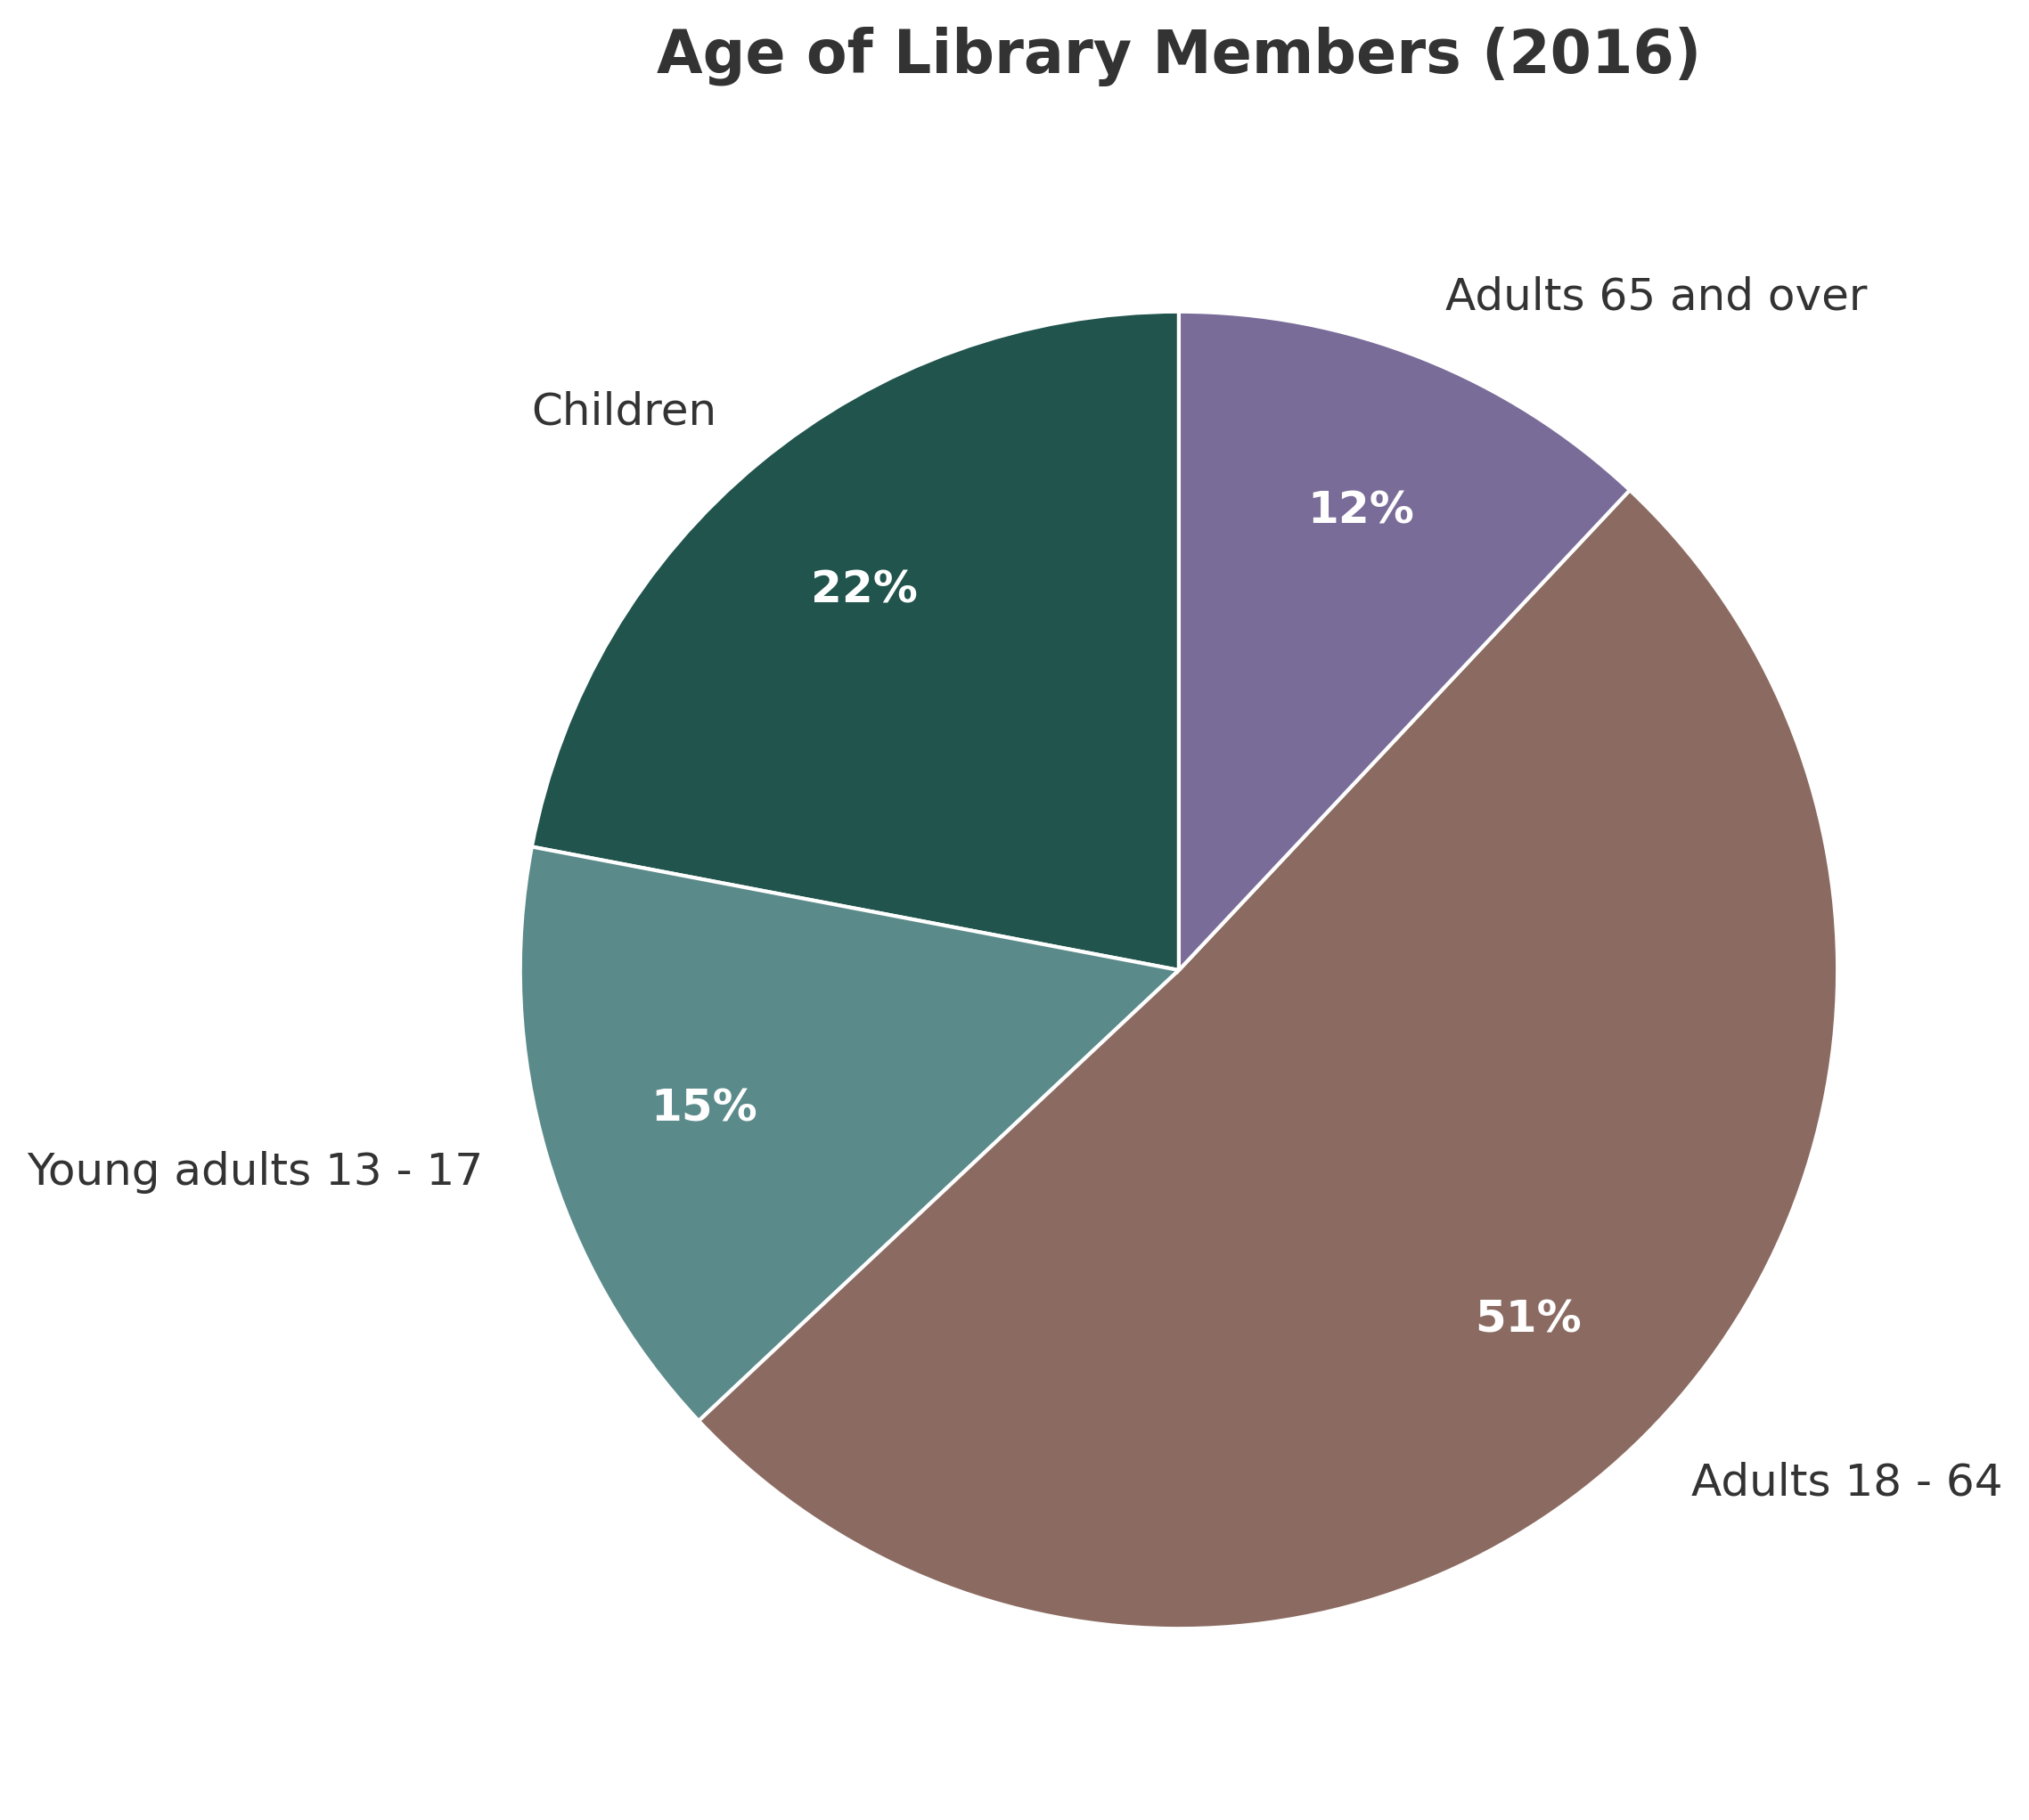
Based on Figure 1, determine if the following statements are True (T) or False (F).
- Over half of the library members are adults aged 18 to 64. [ ]
- Children make up a smaller proportion of members than seniors (65+). [ ]
- Young adults (13-17) account for exactly 15% of the membership. [ ]
- The smallest membership group is the 'Adults 65 and over' category. [ ]
Activity 3: Identifying the Proportion
Look at the Table and the Pie Chart. Which of the following describes the percentage of Adult non-fiction loans compared to the percentage of Adult (65+) members?
- A. They are identical.
- B. Adult non-fiction loans are slightly higher than the senior membership percentage.
- C. Adult non-fiction loans are lower than the senior membership percentage.
- D. Senior membership is double the percentage of non-fiction loans.
Answer: ______
Activity 4: Trend Analysis - Bar Chart Gap-Fill
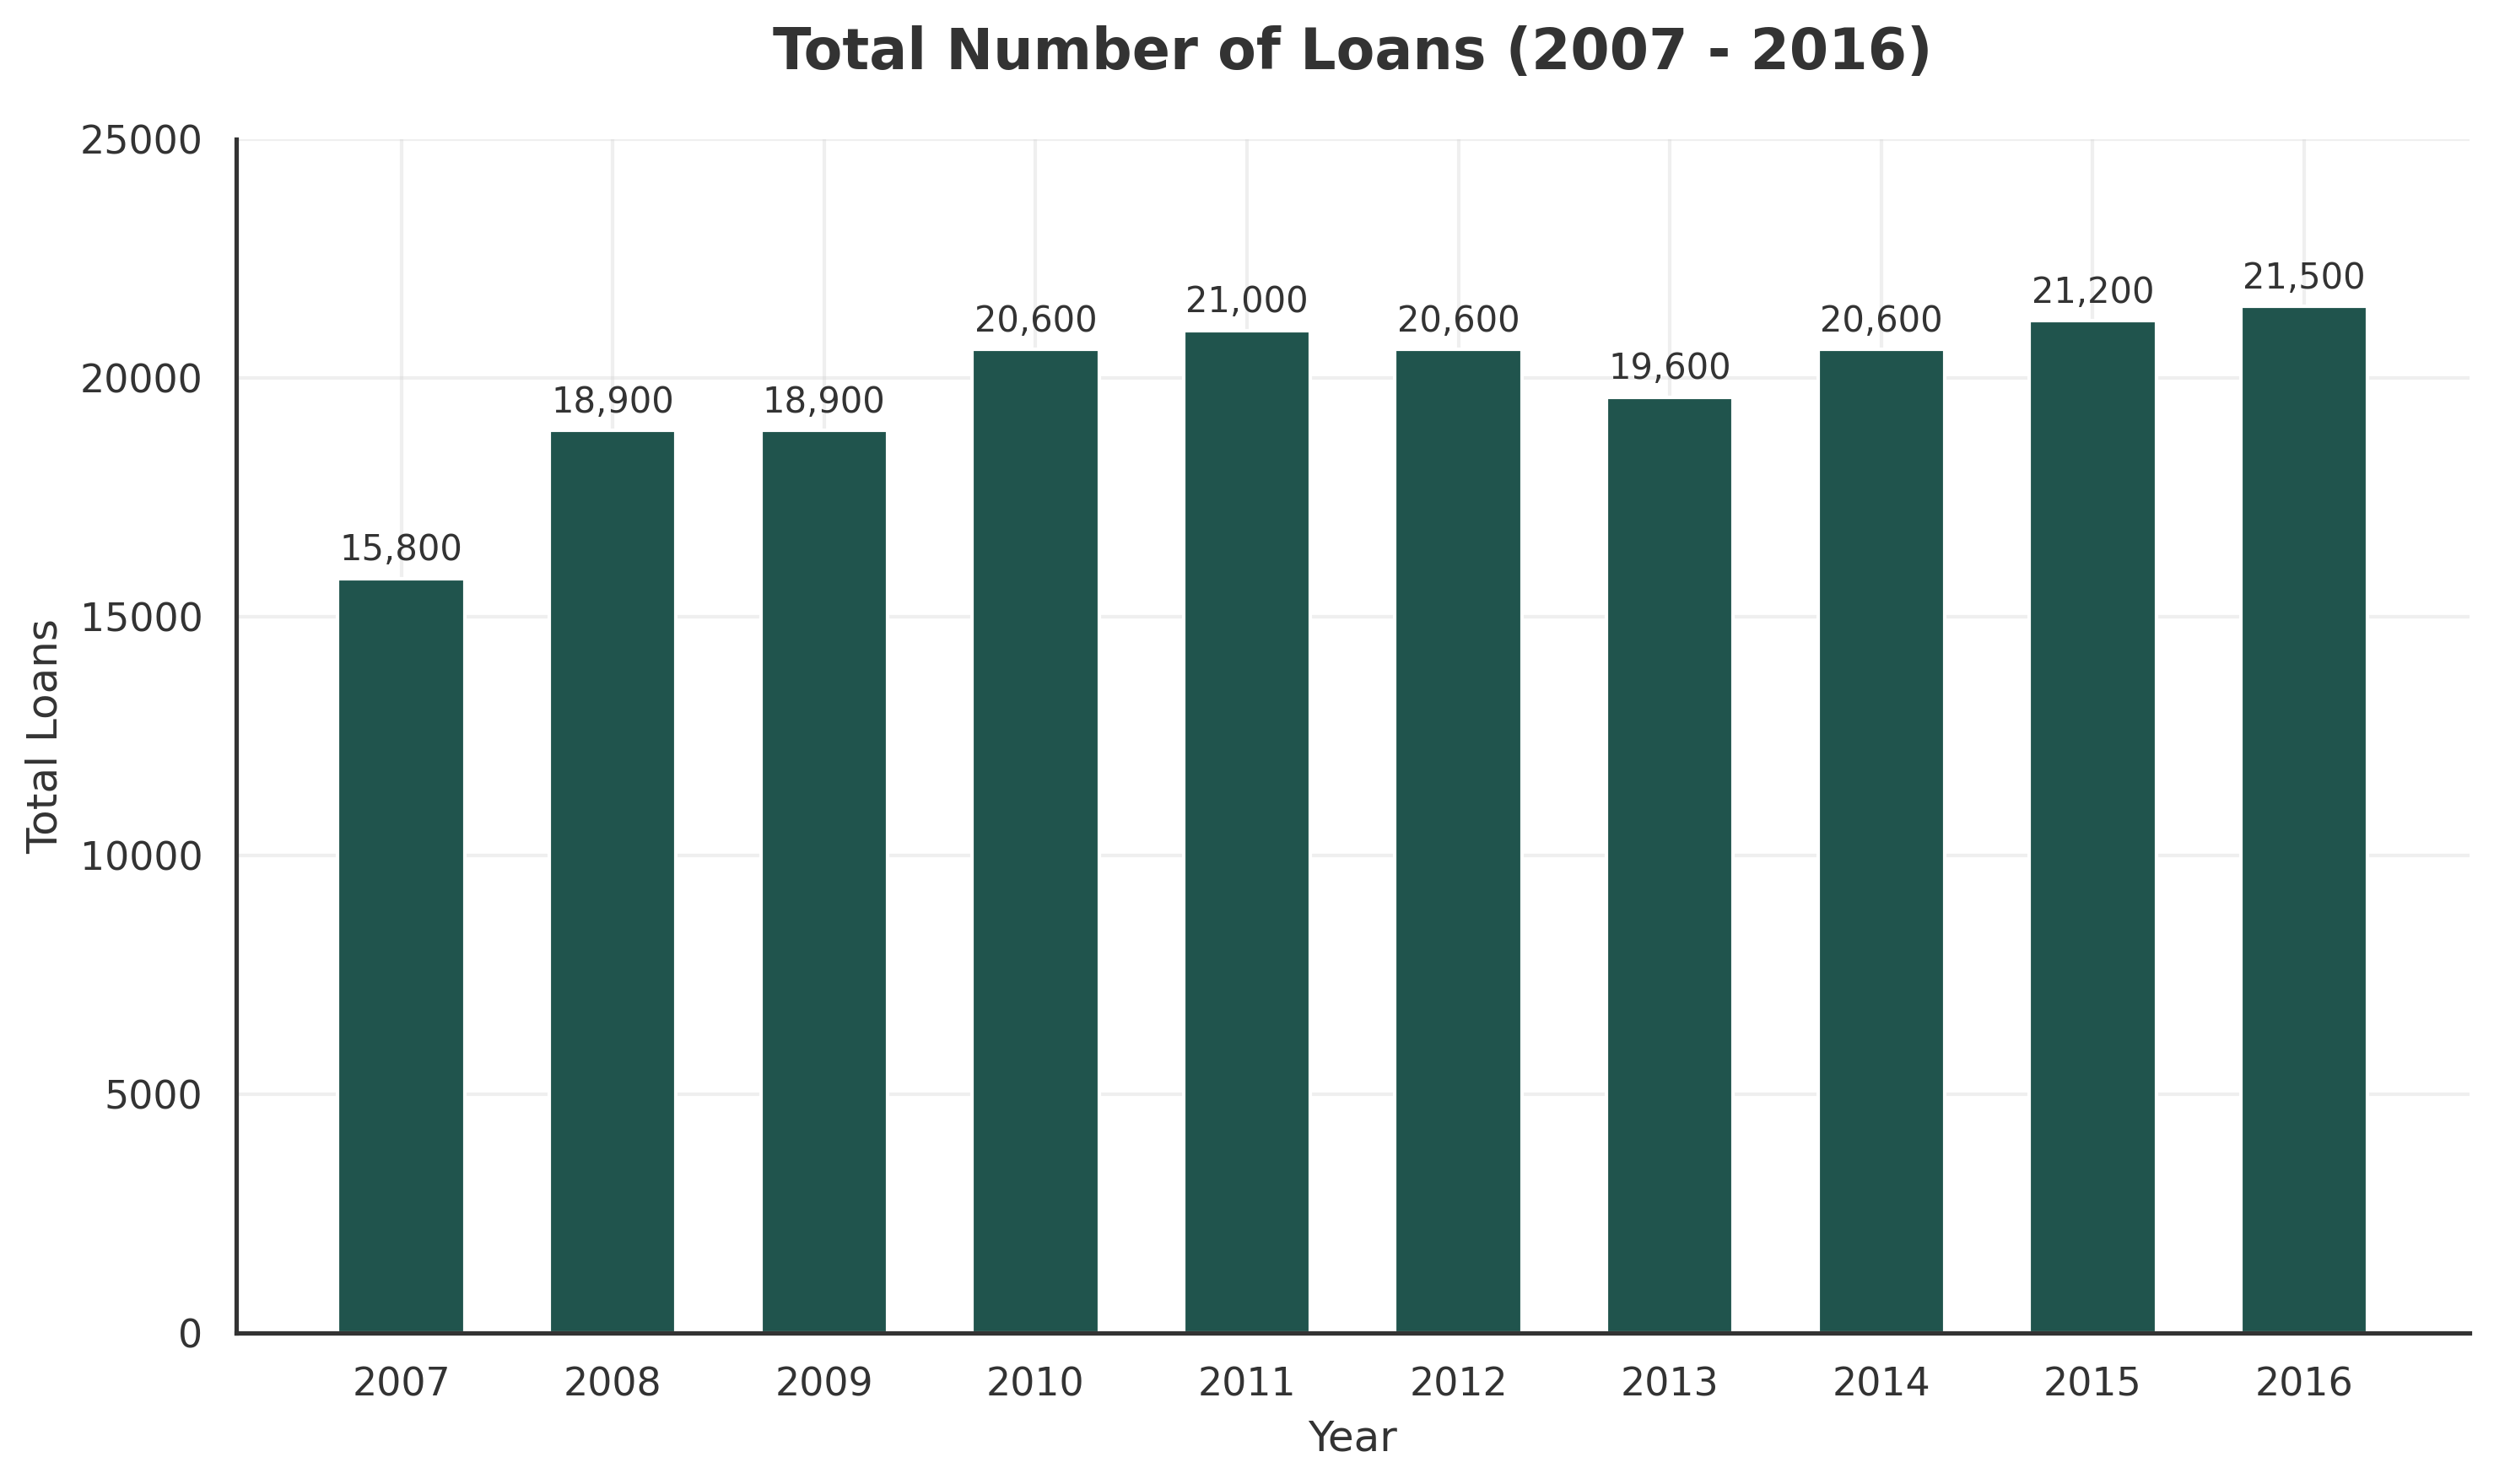
Complete the description of Figure 2 using words from the randomized word bank below.
Word Bank: (peak, 2007, 21,500, upward, slight, 15,800)
In ______, the total number of loans started at roughly ______. Over the next nine years, the library experienced a general ______ trend. Despite a ______ dip in 2013, the numbers recovered to reach a ______ of approximately ______ by 2016.
Activity 5: Synonyms for the Introduction
In IELTS Task 1, you must paraphrase the prompt. Write a synonym for each of the following words found in the prompt: "The charts below (1) give (2) information about (3) a public (4) library..."
-
-
-
-
Activity 6: Selecting the Best Overview
Which of the following sentences would be the most effective Overview for this report?
- A. The bar chart shows that loans were 15,800 in 2007 and grew to 21,500 in 2016, which is an increase.
- B. Overall, adult members constitute the majority of the library's users, while fiction remains the most popular loan category for both adults and children.
- C. Most people who go to the library are between 18 and 64 and they like to borrow books about fiction more than non-fiction or DVDs.
- D. There are seven categories in the table and four categories in the pie chart, showing a lot of data about 2016.
Answer: ______
Activity 7: Comparative Adjectives Practice
Write three sentences comparing the loan categories from the table using the following structures:
- (more popular than): _________________________________________________________________
- (as ... as): _________________________________________________________________________
- (the least): _________________________________________________________________________
Activity 8: Prepositions of Change
Choose the correct preposition to complete each sentence about the Bar Chart.
- Loans increased (by / to) 5,700 between 2007 and 2016.
- The number of loans stood (at / in) approximately 19,000 in 2008.
- There was a rise (of / in) the total number of loans over the decade.
- The figures reached a peak (on / at) 21,500 in the final year.
Activity 9: Prompt Rephrasing Task
Rewrite the following sentence using your own words: "Summarise the information by selecting and reporting the main features, and make comparisons where relevant."
Activity 10: Logical Sequencing
Reorder these sentences (A-D) to create a logical body paragraph about the 2016 loan data.
A. Conversely, non-print media such as DVDs and audio books accounted for the smallest shares, at 1% and 2% respectively.
B. Regarding the types of items borrowed, fiction was by far the most dominant category.
C. Both children's and adult fiction each represented 38% of the total loans.
D. Non-fiction followed at a much lower rate, with adults borrowing 13% and children only 6%.
Correct Order: ____ -> ____ -> ____ -> ____
Activity 11: Categorizing the Data
Look at the Table. Group the categories into two logical sets for a body paragraph. Explain your reasoning.
Set 1: ___________________________________________________________________________________________
Set 2: ___________________________________________________________________________________________
Reasoning: ______________________________________________________________________________________
Activity 12: Sentence Combining - Using 'While'
Combine these two facts into one complex sentence using the word "while":
- Fact 1: Adults aged 18-64 make up 51% of the membership.
- Fact 2: Seniors aged 65 and over make up only 12%.
Activity 13: Spotting the 'Odd One Out'
In the Bar Chart (Figure 2), which year breaks the consistent upward trend? What happened in that year?
Year: __________ Description: ____________________________________________________________________
Activity 14: Matching Scrambled Categories
Draw lines to match the category to its correct percentage based on the Table provided.
- Young Adults A. 1%
- Children's Non-fiction B. 38%
- Children's DVDs C. 2%
- Adult Fiction D. 6%
Activity 15: Adjective Intensity
Choose the most appropriate adjective to describe the changes/proportions.
- The difference between children's fiction and non-fiction loans is (slight / significant).
- Adult members (18-64) represent a (marginal / substantial) portion of the library community.
- The growth in loans over the 10-year period was (steady / volatile).
Activity 16: Brainstorming an Outline
Create a 4-paragraph plan for a 150-word report on this data.
- Introduction: _______________________________________________________________________________
- Overview: ___________________________________________________________________________________
- Body Paragraph 1 (Focus): ____________________________________________________________________
- Body Paragraph 2 (Focus): ____________________________________________________________________
Activity 17: Error Correction (Grammar)
Correct the errors in the following student sentence:
"The amount of loans was increase from 15,800 in 2007 to 21,500 in 2016."
Activity 18: Error Correction (Data Accuracy)
Identify the factual error in this statement:
"In 2016, more people borrowed adult non-fiction than children's non-fiction, but children's DVDs were the most popular item overall."
Correction: ______________________________________________________________________________________
Activity 19: Data Synthesis
Write one sentence that links a fact from the Pie Chart (membership) to a fact from the Table (loans).
Activity 20: Self-Correction Checklist
Create a 5-point checklist that a student should use to review their finished IELTS Writing Task 1 report.
-
-
-
-
-