Generated with Monsha
Mastering IELTS Writing Task 1: Comprehensive Skills Worksheet
Smart Worksheet · Grade 12 · English
Mastering IELTS Writing Task 1: Comprehensive Skills Worksheet
IELTS Writing Task 1: Skills & Strategies
This worksheet is designed to help you master the key skills required for IELTS Writing Task 1. You will practice describing trends, comparing data, and explaining processes across various visual formats.
Section 1: Understanding the Basics
Activity 1: Identifying Visual Types
Match the following descriptions to the correct visual type. Write the letter of the visual next to its description.
A. Line Graph | B. Bar Chart | C. Pie Chart | D. Table | E. Process Diagram | F. Map
- Used to compare discrete categories or groups. [___]
- Illustrates changes in data over a continuous period of time. [___]
- Displays data in rows and columns for precise numerical comparison. [___]
- Shows the proportions of a whole (percentages). [___]
- Visualizes a sequence of steps or a cycle. [___]
- Shows geographical changes or the layout of a place. [___]
Activity 2: Paraphrasing the Prompt
In IELTS Writing Task 1, you must paraphrase the question. Rewrite the following prompt using synonyms and different sentence structures.
Original Prompt: "The graph below shows the number of international tourists in three countries between 2000 and 2020."
Your Paraphrase:
Section 2: Describing Trends (Line Graphs)
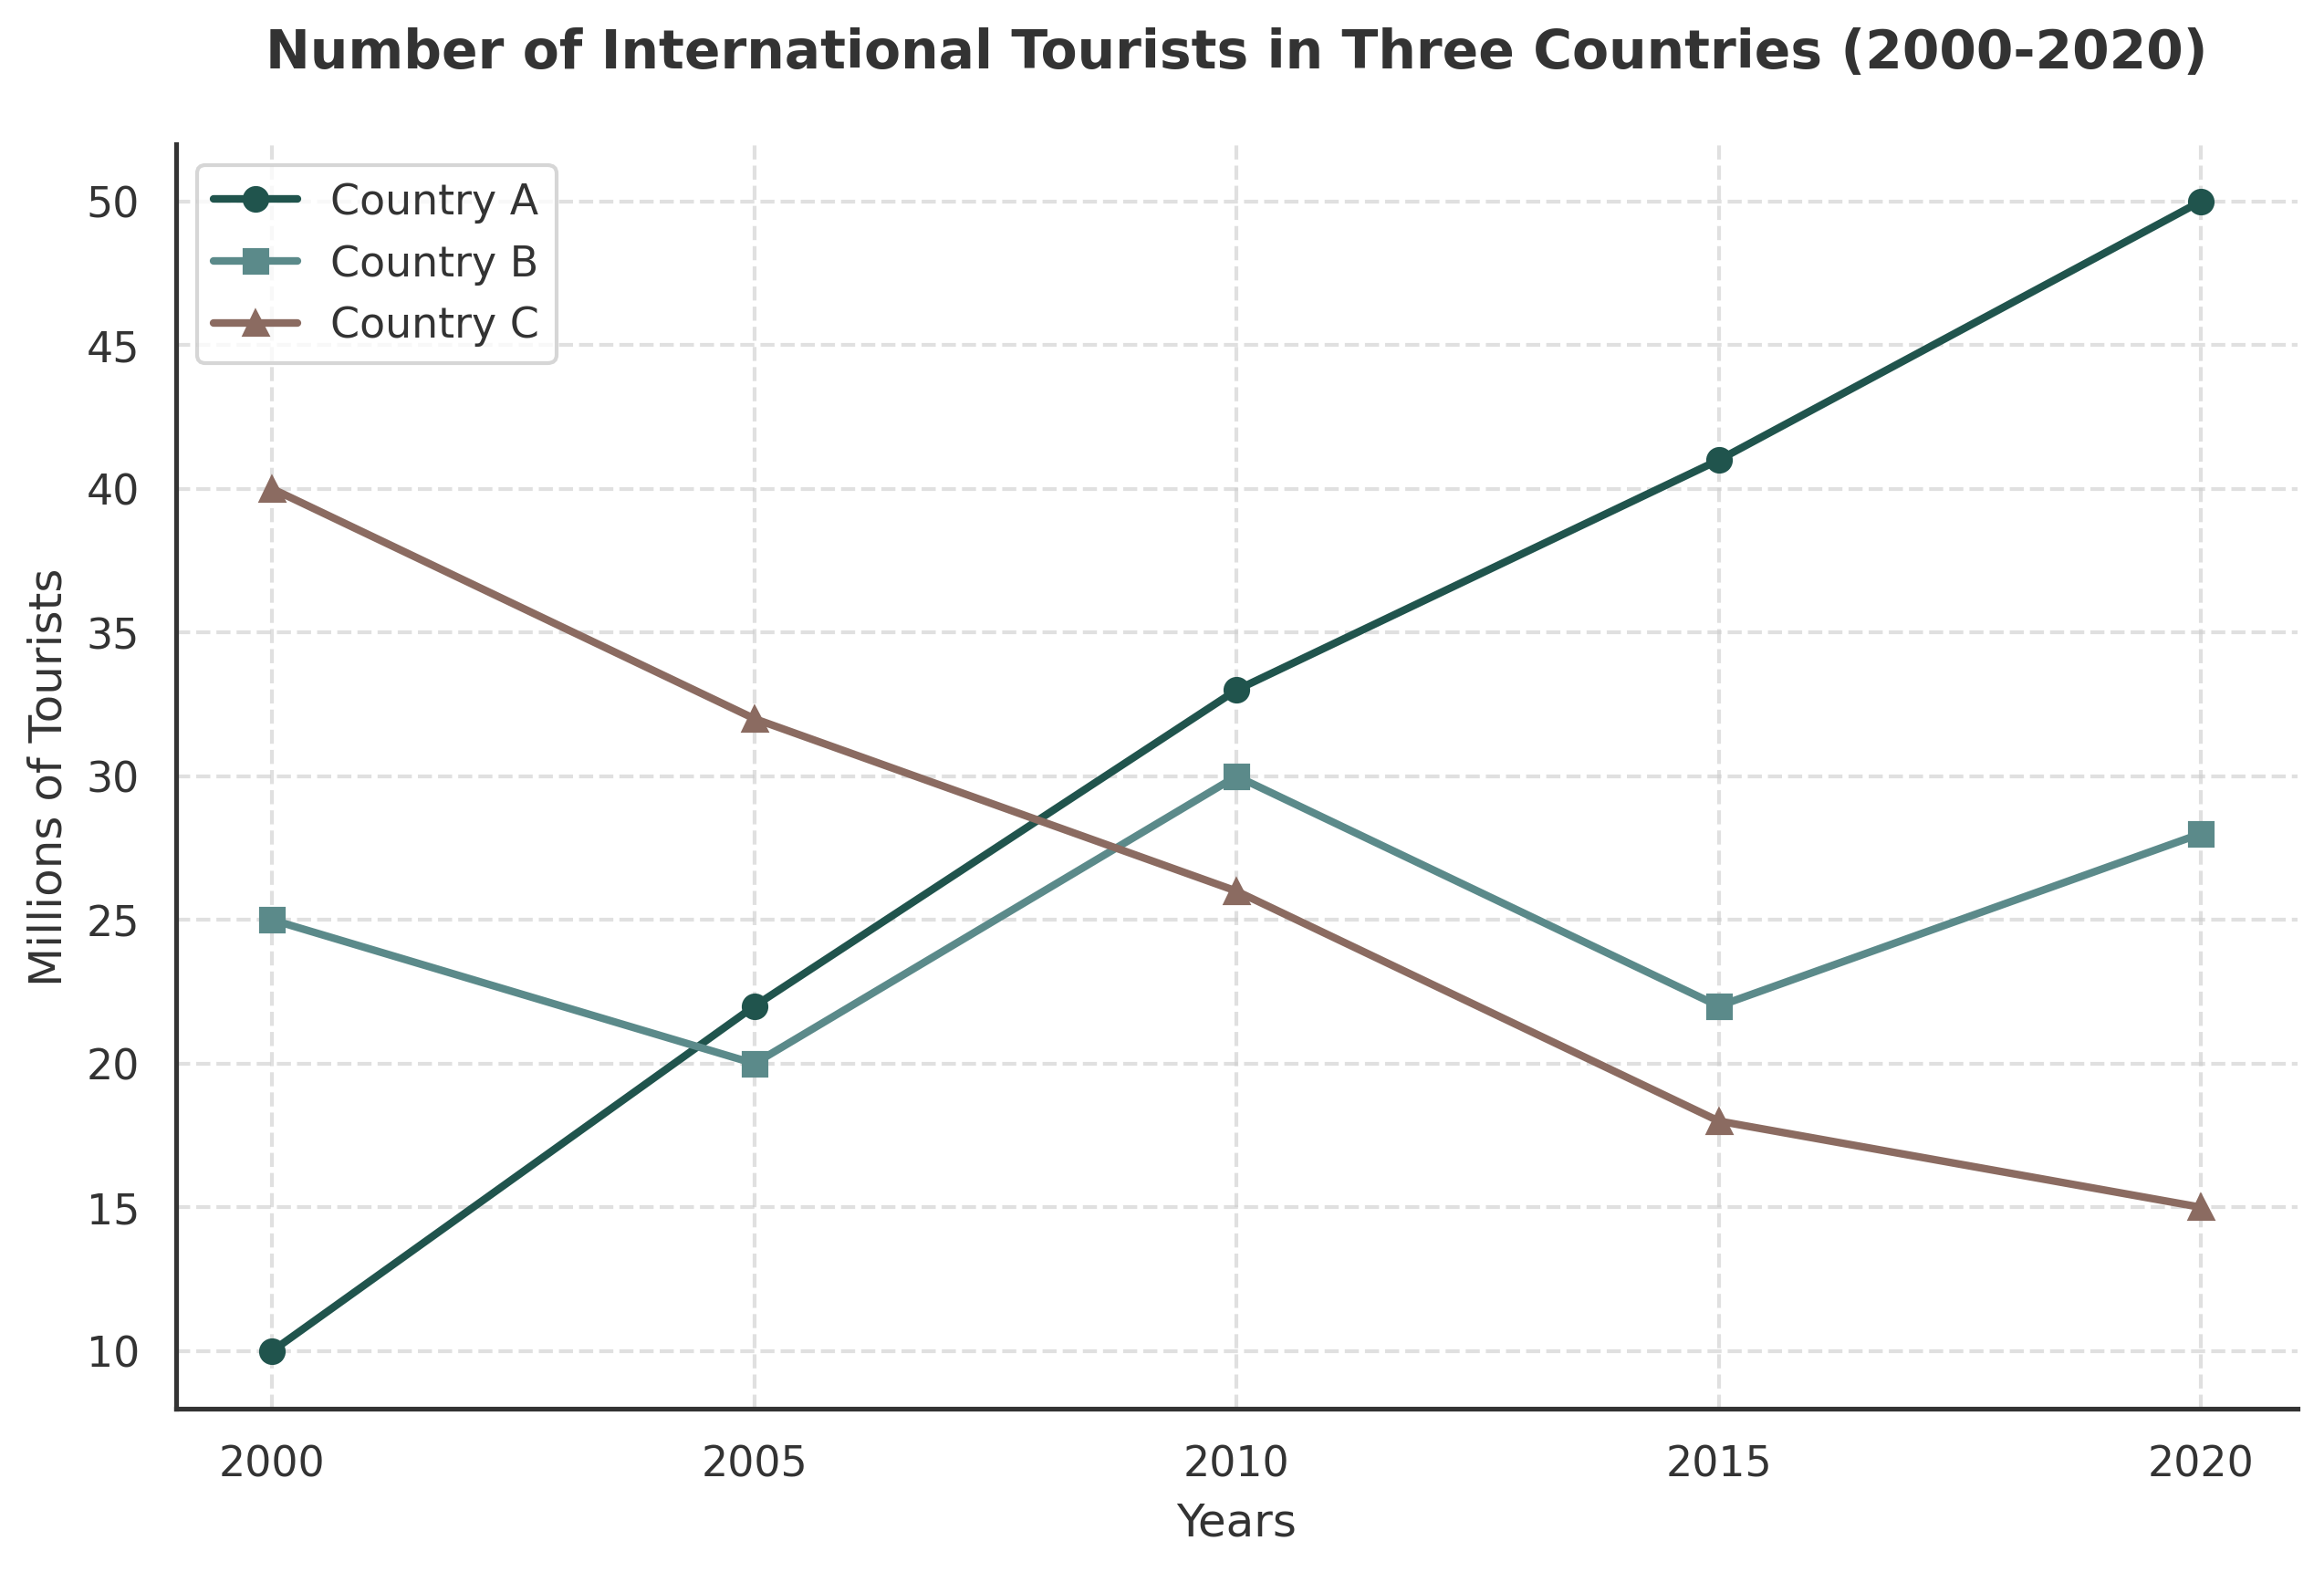
Activity 3: Analyzing the Axes
Look at Figure 1 and answer the following questions to ensure you understand the data scale.
- What does the horizontal (X) axis represent? __________________________
- What does the vertical (Y) axis represent? __________________________
- What is the unit of measurement used for the tourists? __________________________
Activity 4: Trend Vocabulary Match
Using Figure 1, match the trend description to the correct country (Country A, B, or C).
- This country experienced a significant and steady increase over the two decades. [___________]
- This country saw a marked decline in visitor numbers. [___________]
- This country’s tourist numbers showed a period of fluctuation. [___________]
Activity 5: Adverbs of Degree
Rank the following adverbs from weakest change (1) to strongest change (5).
- [___] Sharply
- [___] Slightly
- [___] Considerably
- [___] Marginally
- [___] Dramatically
Activity 6: Prepositions of Time and Data
Fill in the blanks with the correct prepositions (at, to, by, in, from, between).
- Country A's numbers rose ______ 10 million ______ 50 million.
- There was a peak ______ roughly 30 million for Country B ______ 2010.
- The figure for Country C fell ______ 25 million over the 20-year period.
- The data was recorded ______ 2000 and 2020.
Activity 7: Writing an Overview
The "Overview" is the most important part of your essay. Write a 2-sentence overview for Figure 1 that summarizes the main trends without using specific numbers.
Section 3: Comparing Categories (Bar Charts)
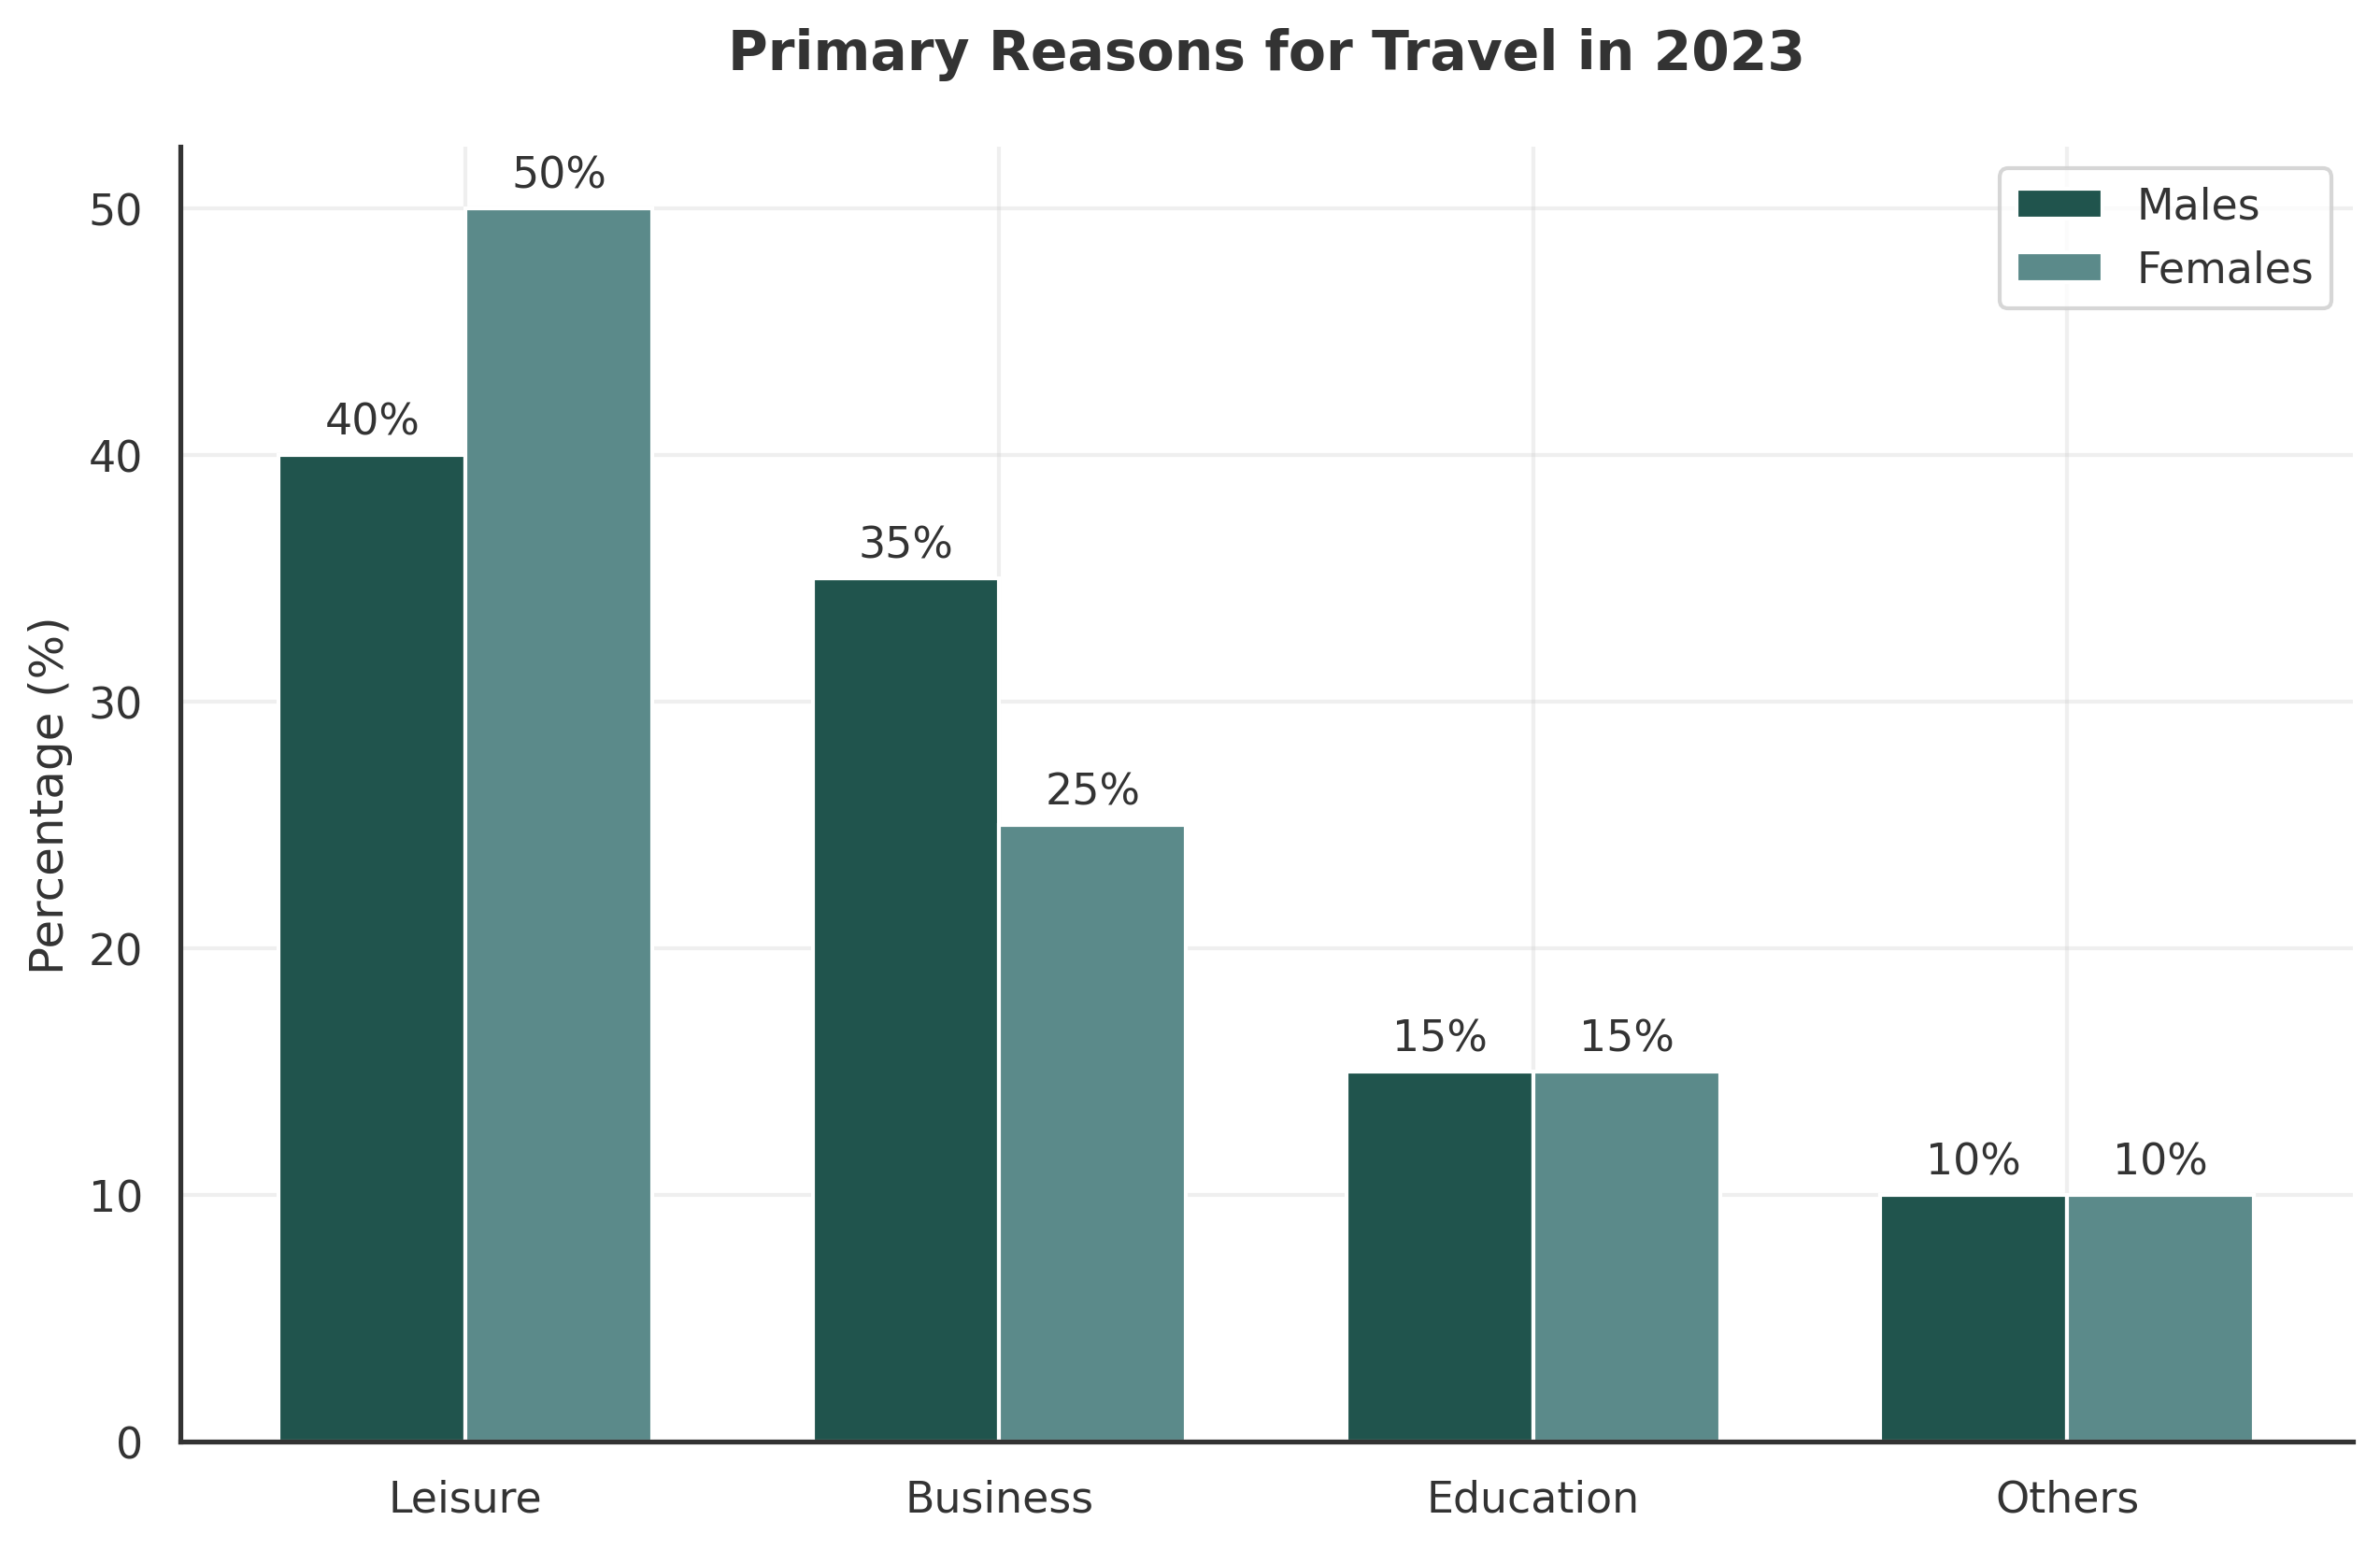
Activity 8: Identifying Main Features
List three key differences or similarities between males and females based on Figure 2.
-
-
-
Activity 9: Comparison Structures
Complete the sentences using comparison words (higher, lower, as many as, twice, whereas).
- The percentage of females traveling for leisure was __________ than that of males.
- Business was the second most popular reason for travel, __________ education was less common.
- Roughly __________ many males traveled for business compared to education.
- The "Others" category had the __________ percentage for both genders.
Section 4: Describing Proportions (Pie Charts)
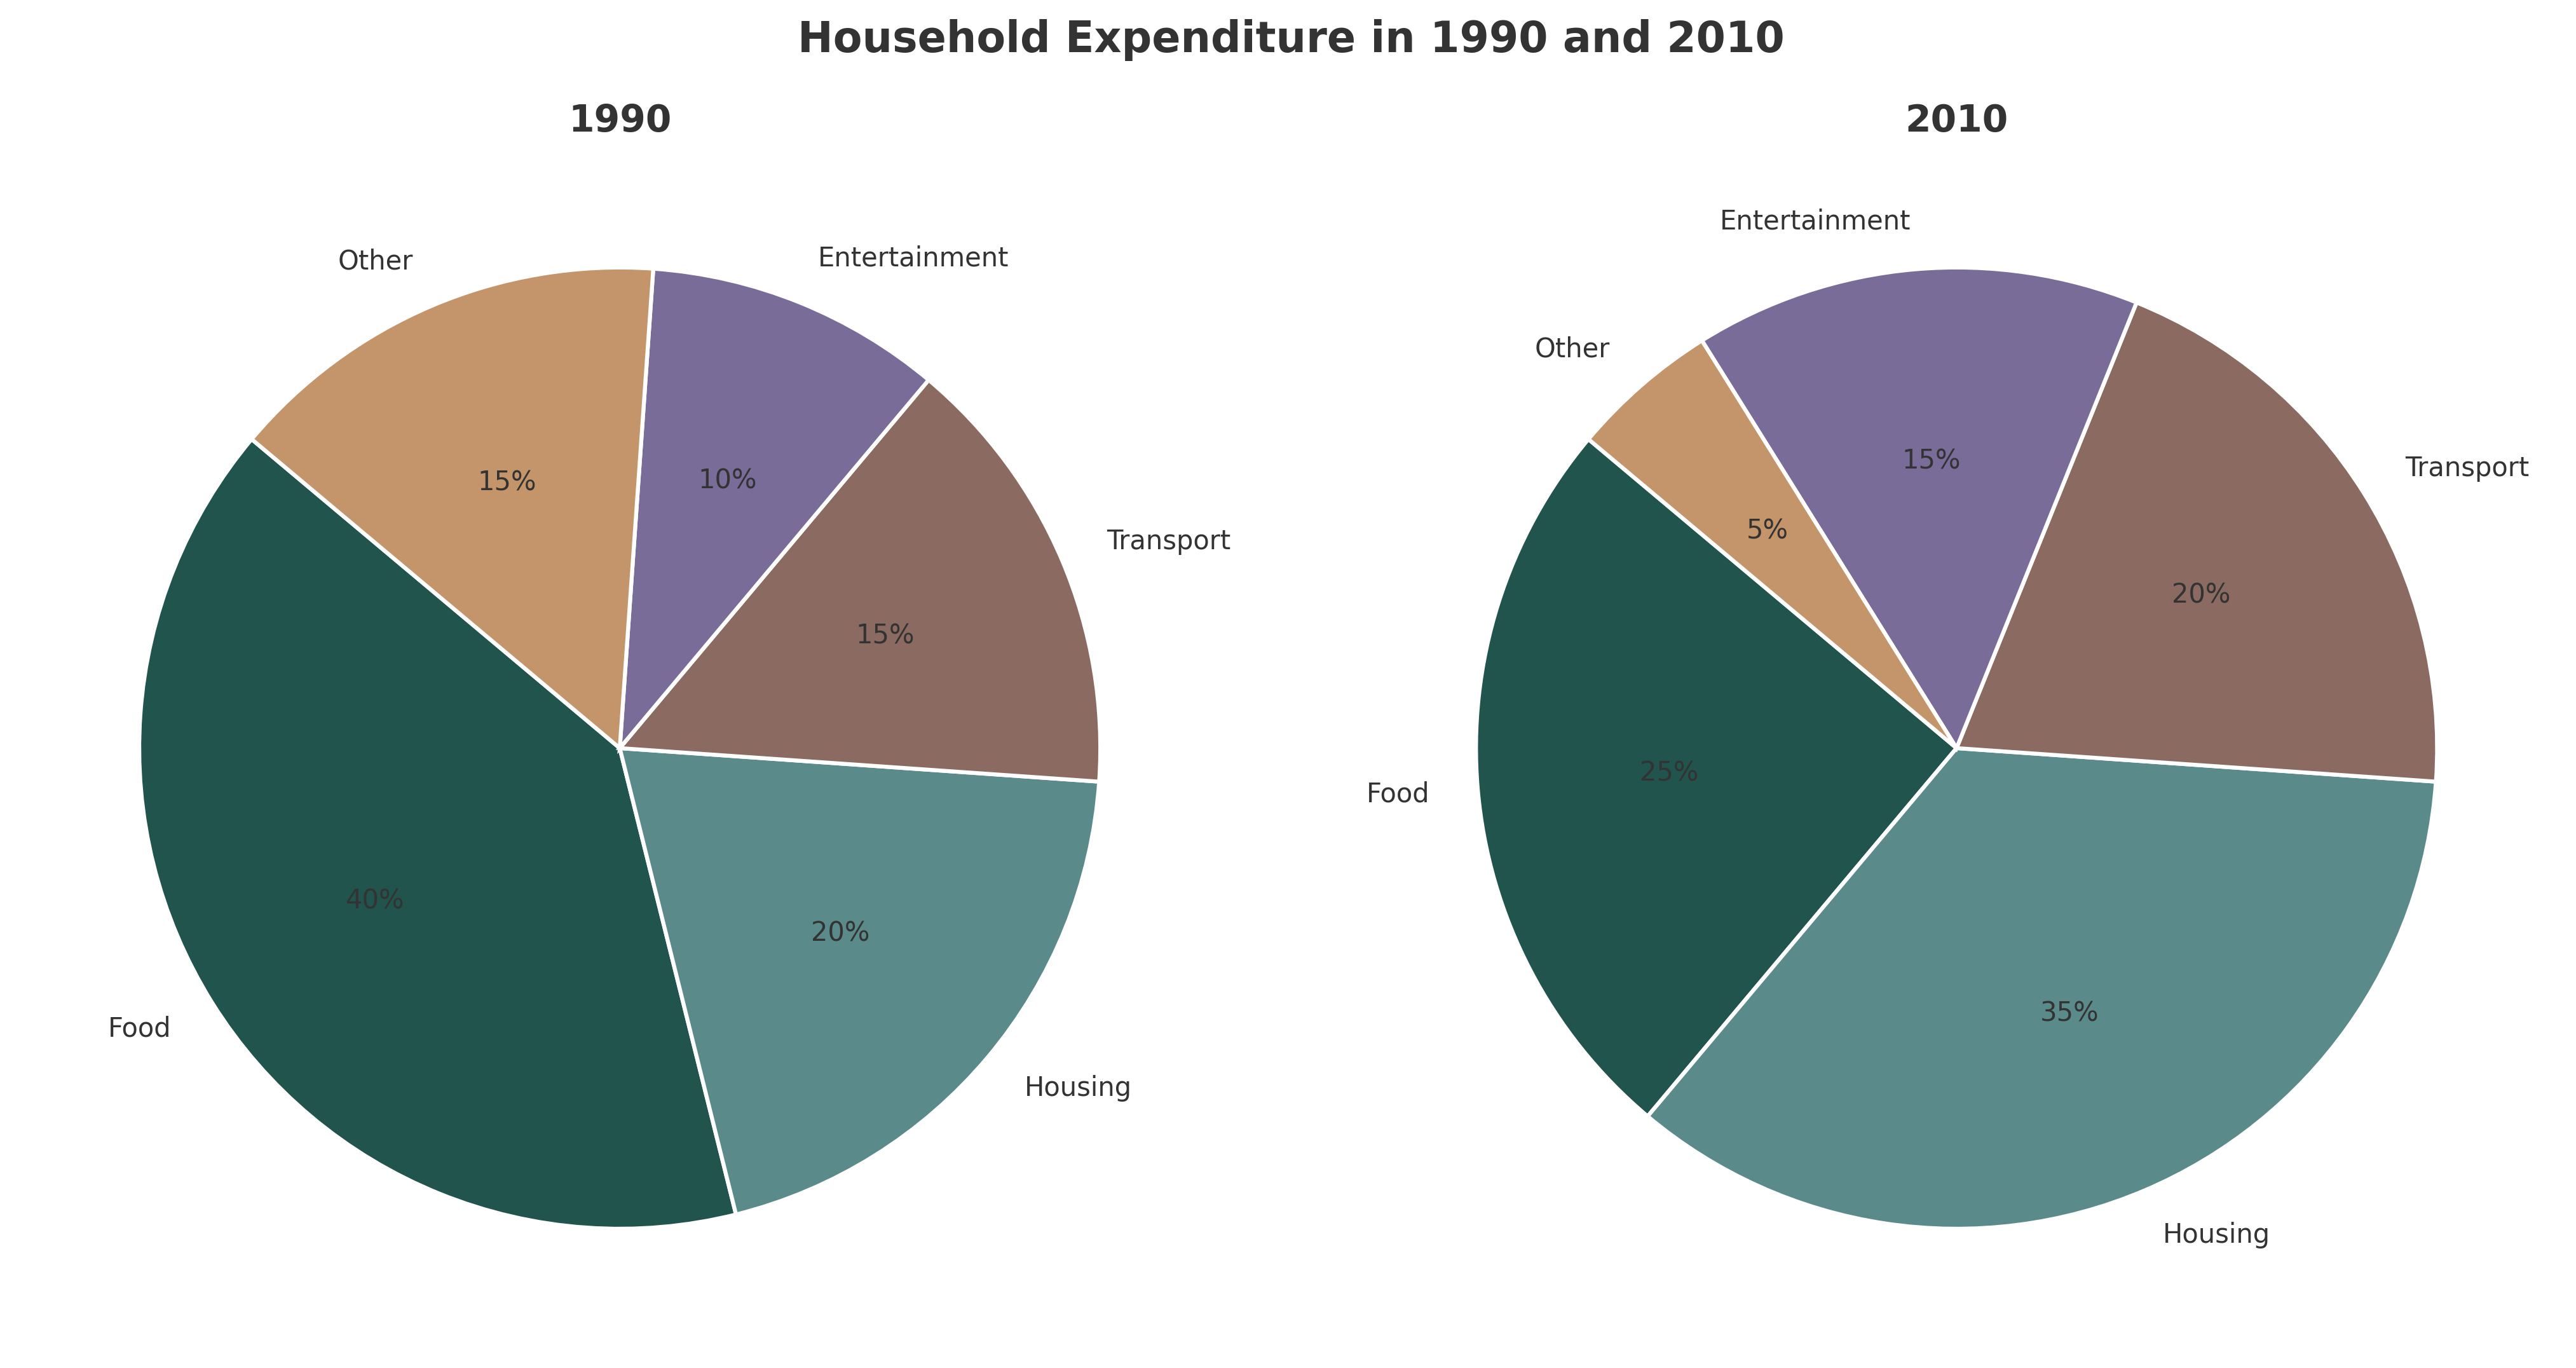
Activity 10: Grouping Data
To organize your response, you should group similar data. Categorize the items from Figure 3 into these two groups based on their change from 1990 to 2010.
Increased in Share | Decreased in Share |
|---|---|
1. | 1. |
2. | 2. |
3. |
Activity 11: Converting Percentages to Fractions
In your writing, it is better to vary your language. Convert the following percentages from the 2010 chart into descriptive fractions (e.g., 25% = a quarter).
- Food (25%): __________________________
- Housing (35%): __________________________
- Transport (20%): __________________________
Activity 12: Proportion Verbs
Choose the correct verb to complete the descriptions of Figure 3.
- In 1990, food (accounted for / resulted in) 40% of total spending.
- Housing (comprised / consisted) over a third of the budget in 2010.
- Entertainment (made up / taken up) 15% of the expenditure by 2010.
Section 5: Describing Processes

Activity 13: Sequencing Words
Use the word bank to fill in the steps for describing the process in Figure 4.
First / Next / Following this / Once / Finally
- __________, the apples are harvested from the orchard.
- __________, they are washed and cleaned to remove dirt.
- __________, the fruit is crushed into a pulp.
- __________ the juice is extracted, it is filtered.
- __________, the juice is put into bottles and labeled for sale.
Activity 14: Diagram Labeling
Based on Figure 4, write the correct action for each stage number shown in the diagram.
- [1] __________________________
- [2] __________________________
- [3] __________________________
- [4] __________________________
- [5] __________________________
- [6] __________________________
Activity 15: The Passive Voice
Process diagrams should be written in the passive voice. Rewrite these active sentences into the passive voice.
- Machines crush the apples. -> ________________________________________
- Workers filter the juice. -> ________________________________________
- They label the bottles. -> ________________________________________
Section 6: Describing Changes (Maps)
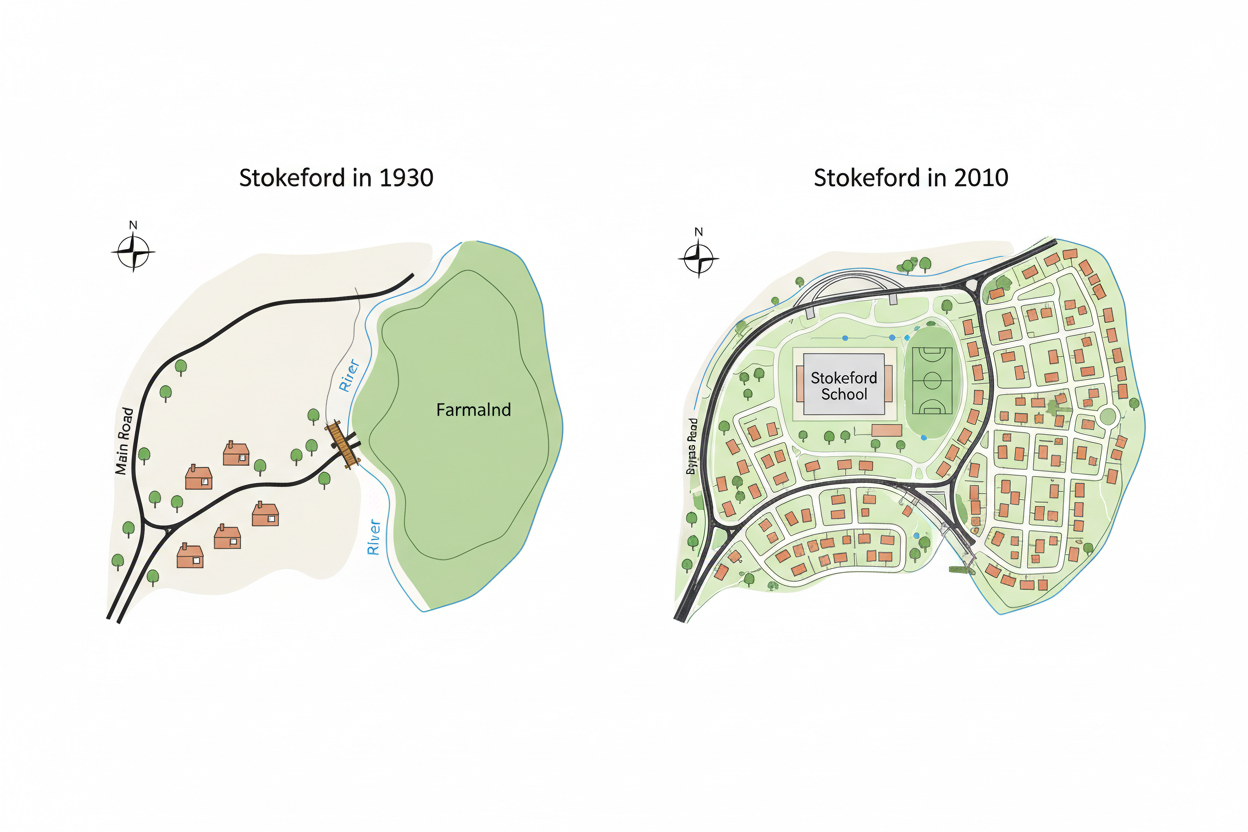
Activity 16: Spatial Vocabulary
Look at Figure 5. Use directional words (North, South, East, West) to describe the changes.
- The large farmland area was located to the __________ of the village in 1930.
- In 2010, a new school was built in the __________-east corner.
- The main road runs from the __________ to the __________ of the map.
Activity 17: Identifying Map Changes
List two major developments that occurred in Stokeford between 1930 and 2010.
-
-
Section 7: Polishing Your Writing
Activity 18: Tense Correction
The following paragraph describes Figure 1 but contains tense errors. Correct the underlined verbs.
In 2000, the number of tourists in Country A (1) stands at 10 million. By 2010, it (2) has risen to 30 million. It is predicted that if the trend (3) continued, it will reach 60 million in the future.
- [] 2. [] 3. [___________]
Activity 19: Jumbled Paragraph (Cohesion)
Reorder these sentences to create a logical body paragraph for Figure 3 (Pie Charts).
[ ] A. In contrast, the proportion of money spent on food saw a significant drop.
[ ] B. This category fell from 40% in 1990 to just 25% in 2010.
[ ] C. Looking at the expenditure, the most noticeable change was in housing.
[ ] D. This figure grew from 20% to 35% over the twenty-year period.
Activity 20: The Final Checklist
Before submitting a Task 1 response, you must check for these elements. Fill in the missing components of a standard Task 1 structure.
- Introduction: ________________ the question.
- Overview: Summarize the ____________ features.
- Body Paragraph 1: Detail specific data and ____________.
- Body Paragraph 2: Detail the remaining data points.